The latest industrial data from the Federal Reserve showed a 2.2% month over month decrease in production for February. That brought the total industrial production index down 4.2% compared to 2020.
Like most macroeconomic data points from February, industrial production numbers were impacted by the Polar Vortex severe weather event. For carriers, key numbers to watch are for manufacturing, which accounts for around 63% of ton-miles in trucking.
February manufacturing output dropped 3.1% m/m. Although this sector is now down 4.25% y/y, manufacturing output increased for nine straight months through January. The largest m/m decrease was in the motor vehicles sector, which posted a 8.3% decrease after being mostly flat since last July. This sector continues to experience supply chain disruptions for parts, including semiconductors as well as a shortage of hot-rolled steel from mills not yet back to pre-pandemic operating capacity.
Find van loads and trucks on the largest load board in North America.
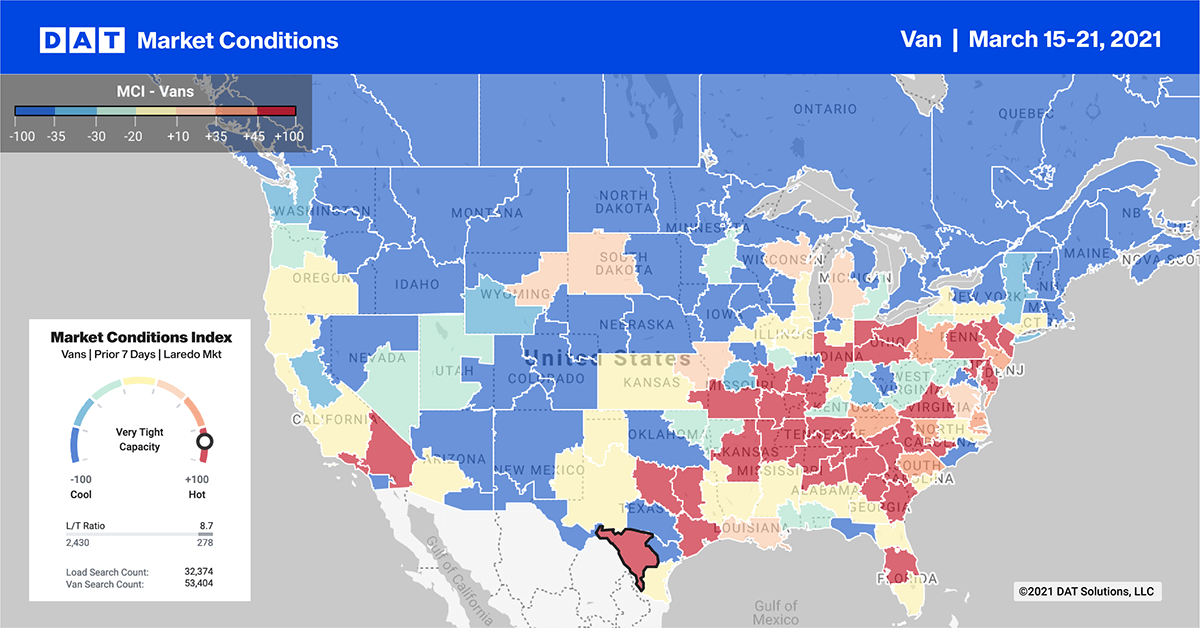
Dry van load posts dropped in all but two of our top 10 markets last week, which collectively dropped by 9% w/w. The only markets posting gains were in Texas. Houston and Dallas recorded 17% and 9% w/w increases in load posts, with little to no change in capacity or spot rates.
The number one market again this week is the logistics hub of Memphis, though volumes dropped 11% w/w. Capacity was tighter, pushing up outbound rates up to an average of $2.85/mile, excluding fuel surcharges.
Capacity eased farther east in Atlanta on 11% w/w lower volumes. Rates dropped to $2.38/mile. A similar story was reported on the West Coast, where rates dropped by $0.05/mile to $2.88/mile in Ontario, CA, and by $0.07/mile to $2.82/mile in Los Angeles.
Spot rates forecast
The national average dry van spot rates could be reaching a ceiling but remains up 30% y/y, or $0.71/mile, compared to the same week in 2020.
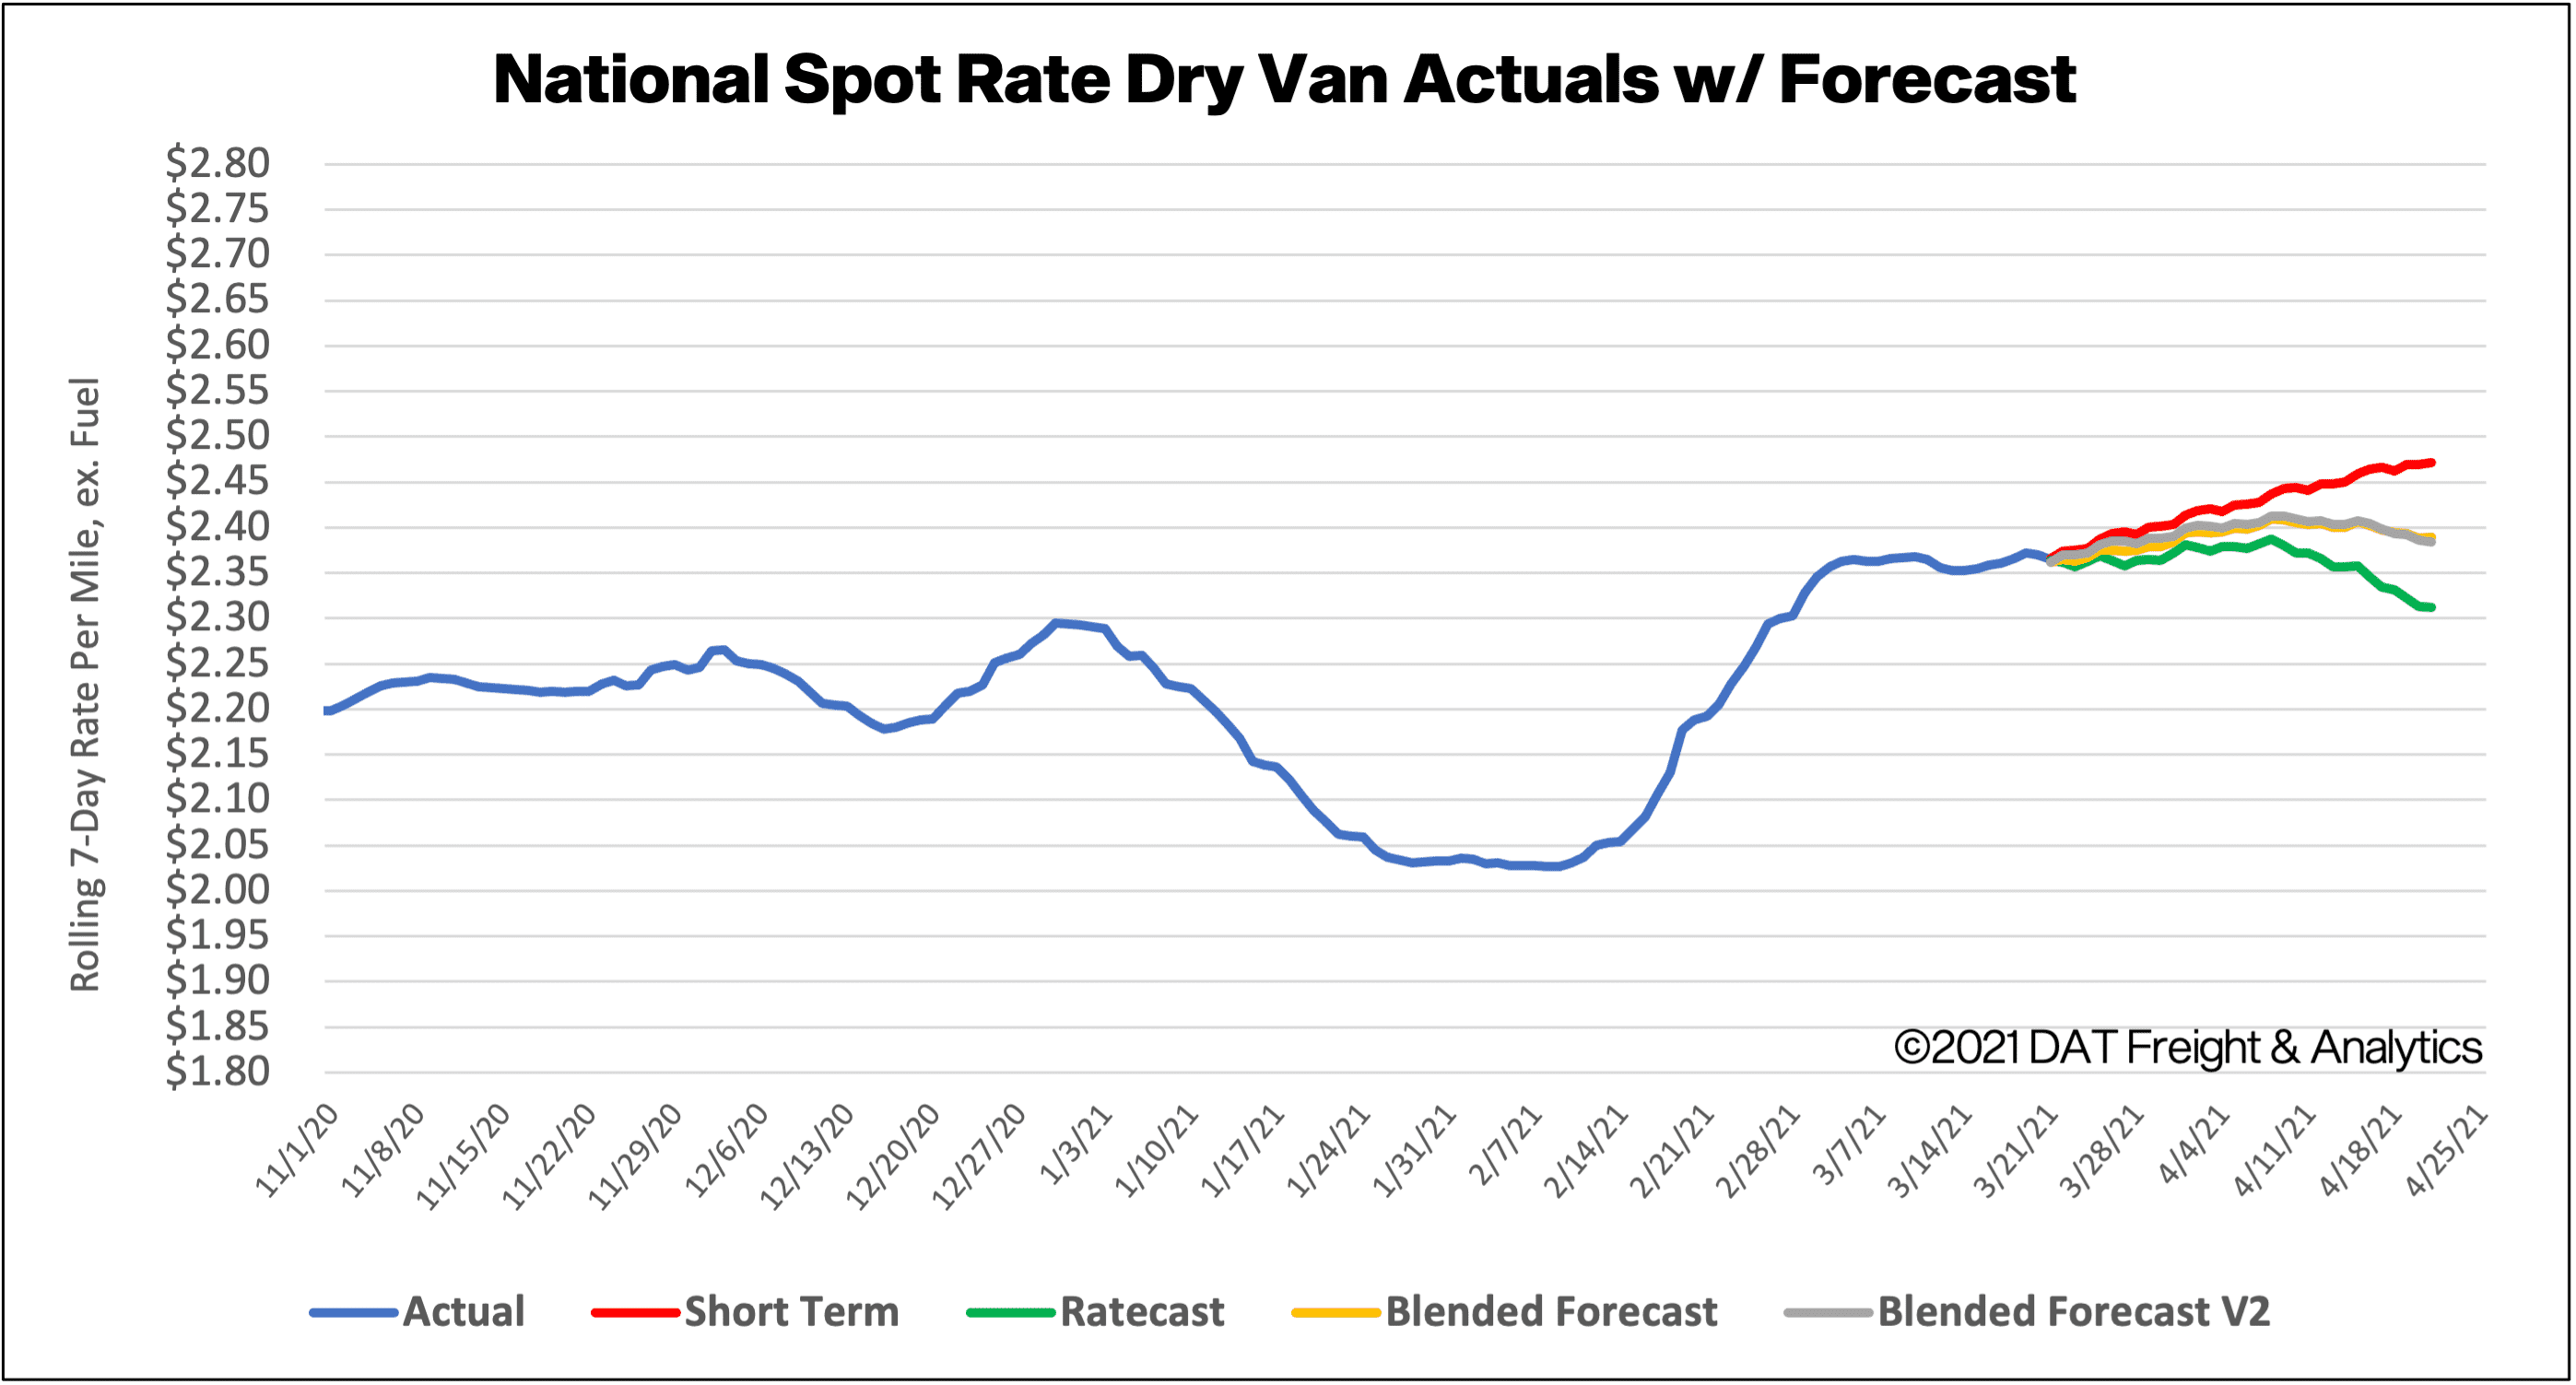
How to interpret the rate forecast:
- Ratecast: DAT’s core forecasting model
- Short Term Scenario: Formerly the pessimistic model that focuses on a more near-term historical dataset.
- Blended Scenario: More heavily weighted towards the longer-term models.
- Blended Scenario v2: More heavily weighted towards the shorter-term models.