June freight volumes finished the month strong, and rates responded to close Q2. Over the past six weeks, van rates have climbed about 10% on the top 100 van lanes. Last week, rates increased on 66 of those lanes and fell on only 24 of them. The remaining 10 held steady.
The national average van rate for June was $1.89/mi., which was 10¢ higher than the May average and the highest monthly average since January. That included large increases in major freight markets like Los Angeles (up 14%), Memphis (up 12%) and Atlanta (up 11%).
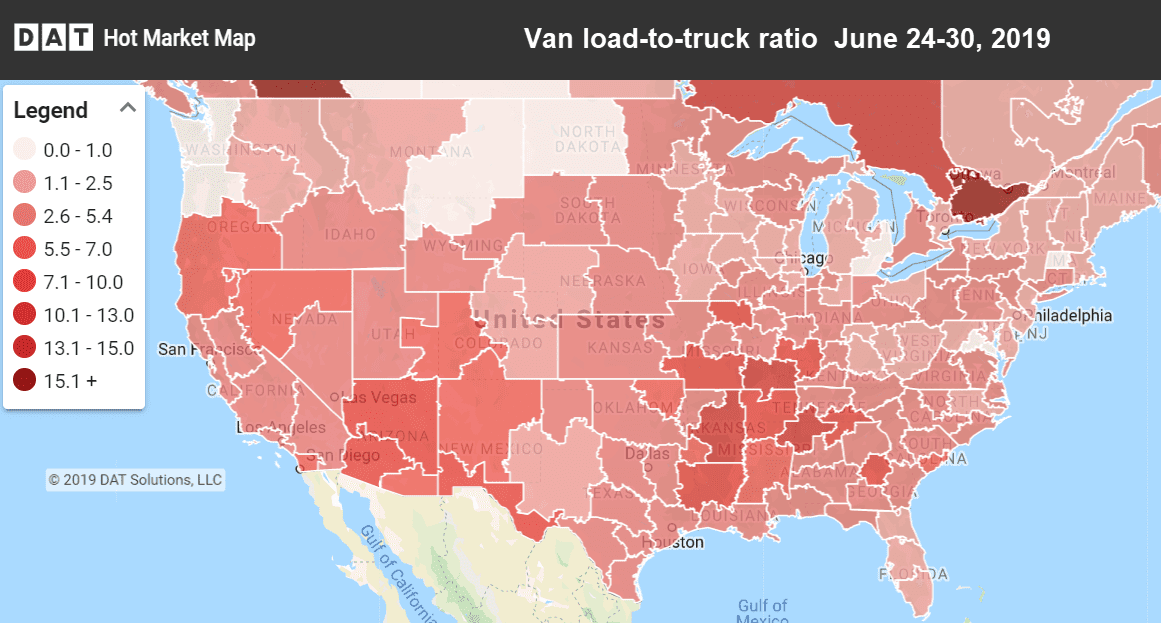
Hot Market Maps in DAT Power and RateView show where trucks are hardest to find. The darker the color, the less competition there is for truckload freight.
Freight volumes up 6% in 2019
Although van rates are lower this year compared to last June’s record prices, freight volumes — the number of loads that actually moved in June — are about even with June 2018. For the first half of the year, van volumes are up 6% compared to the same period in 2018.
Rising Rates
Lanes with the largest rate increases were generally those moving West to East. The big surge came on lanes going from the Central U.S. to the Northeast.
- Chicago to Buffalo surged 31¢ to $2.56/mi.
- Memphis to Columbus, OH, jumped 27¢ to $2.51/mi.
- Buffalo to Allentown, PA, rose 15¢ to $2.99/mi.
- Memphis to Chicago gained 13¢ to $2.41/mi.
- Out West, Stockton, CA, to Portland also added 13¢ moving up to $3.02/mi.
Falling Rates
While almost all of the major van markets showed price gains, rates coming out of Seattle dipped last week. Seattle has seen prices slip 6% over the past month. Also, rates coming out of Houston were slightly lower last week.
- Houston to Oklahoma City slipped 15¢ to $2.02/mi.
- Houston to Dallas moved down 5¢ to $2.27/mi.
- That’s about it. Other dips were just pennies per mile.
Find loads, trucks and lane-by-lane rate information in DAT load boards, including rates from DAT RateView.


