The latest release of the American Trucking Associations’ seasonally adjusted For-Hire Truck Tonnage Index decreased 1.2% in July after falling 2% in June. According to ATA Chief Economist Bob Costello:
“Softness in tonnage over the last few months is due more to supply constraints, rather than a big drop in freight volumes. Not only are there broader supply chain issues, like semiconductors holding tonnage back, but there are also industry specific difficulties, including the driver shortage and lack of equipment.
For-hire truckload carriers are operating fewer trucks than a year earlier. It is difficult to haul significantly more freight with fewer trucks and drivers.
In addition to these supply issues, retail sales and housing starts, both large drivers of truck freight, retreated in July. Although both rose on a year-over-year basis.”
The ATA index is down 2.9% compared to July of 2020 after declining for the past consecutive four months and year-to-date overall. Compared with the same seven months in 2020, tonnage is down 0.2%.
The Index is dominated by contract freight as opposed to spot market freight and serves as a barometer of the U.S. economy. It represents 72.5% of tonnage carried by all modes of domestic freight transportation, including manufactured and retail goods.
Find loads and trucks on the largest load board network in North America.
Note: All rates exclude fuel unless otherwise noted.
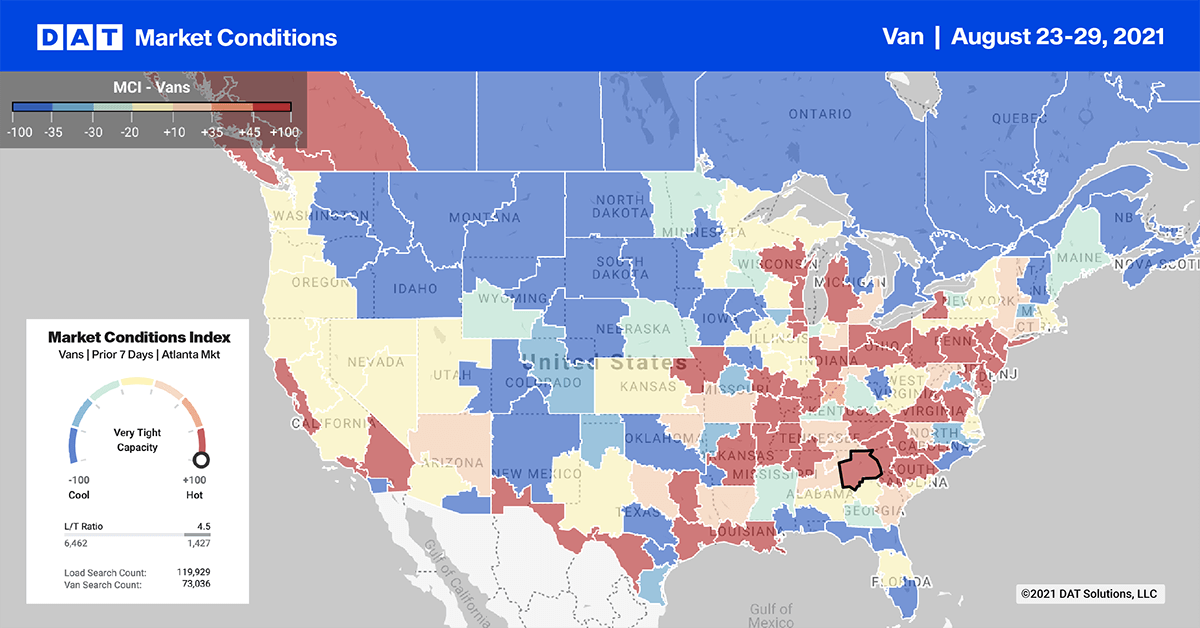
After lacking direction for the prior few weeks, the spot market found some energy last week as shippers continue to restock depleted retail inventories ahead of the Labor Day long weekend.
Adding to last week’s volume surge was the news that Hurricane Ida was taking aim at the Gulf Coast over the weekend. This caused inbound New Orleans spot market volumes for dry van trailers to jump by 5% last week. Shippers also moved as much freight as they could out of the way of the devastating storm, driving up spot volumes by 19%.
Outbound spot rates from New Orleans were up $0.05/mile last week to an average of $2.44/mile. Spot rates for loads on the 348-mile run from New Orleans to Houston increased by $0.26/mile to an average of $2.65/mile last week.
Spot rates
After remaining flat for the last month, dry van spot rates increased by $0.02/mile last week to a national average of $2.45/mile. Compared to the same week last year, dry van rates are $0.40/mile higher and $0.65/mile higher than the same period in 2018.
Of our Top 100 lanes (for loads moved), spot rates:
- Increased on 49 lanes (compared to 33 the week prior)
- Remained neutral on 31 lanes (compared to 41)
- Decreased on 20 lanes (compared to 26)
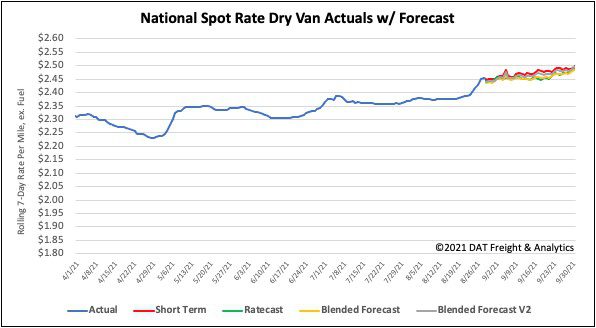
How to interpret the rate forecast:
- Ratecast: DAT’s core forecasting model
- Short Term Scenario: Formerly the pessimistic model that focuses on a more near-term historical dataset
- Blended Scenario: More heavily weighted towards the longer-term models
- Blended Scenario v2: More heavily weighted towards the shorter-term models


