The Biden Administration recently announced that Georgia’s Port of Savannah will be able to reallocate $8 million to create five temporary inland ‘pop-up’ container yards to help ease congestion at the port. Of course, Savannah isn’t the only port struggling to handle surging import container volumes. However, this project does underscore how serious this problem has become.
Get the clearest, most accurate view of the truckload marketplace with data from DAT iQ.
Tune into DAT iQ Live, live on YouTube or LinkedIn, 10am ET every Tuesday.
The Port of Savannah is the nation’s fourth-busiest port. It handled 10% of inbound containers in October. Volumes were up 12% sequentially in October and are now up 14% compared to last year.
To put that into perspective, Savannah has handled just over one million more total containers in the first 10 months of 2021 compared to the same period last year. That’s a 50% increase since the start of the year.
Find loads and trucks on the largest load board network in North America.
Note: All rates exclude fuel unless otherwise noted.
Space remains the big challenge for everyone at the moment. Ports, intermodal ramps, warehouses and distribution centers are all full. But none more so than the nation’s largest port complex in Los Angeles where 35% of all containerized imports arrive.
There are 83 container vessels loaded with 589,081 containers waiting to unload an average of 16.9 days. It’s looking increasingly like some of these containers won’t make it to their final destination in time for the holiday shopping season.
Shippers have already been shuffling goods from one warehouse to another when goods arrived too late for summer sales, and now they’re competing with winter stock for space.
B.J. Patterson, CEO of Pacific Mountain Logistics in San Bernardino, California, shared that his organization was forced to make room for unsold summer-season patio furniture because it arrived too late. That inventory was moved first to Nevada, then to Arizona, and finally to Texas.
“It’ll sit there until spring comes when they’ll try to sell it,” he said. “There’s going to be a lot of cheap patio furniture out there.”
Mexico is our second largest market for both imports and exports, with most of the truckload volume focused on the Texas freight market, especially Laredo. In fact, 36% of truck crossings into the U.S. entered via Laredo where capacity continues to tighten this week.
Spot rates are up $0.05/mile over the last month to an average of $2.25/mile. On the high-volume lane from Laredo to Ft. Worth, spot rates have jumped $0.20/mile since October to an average of $3.06/mile. Capacity for loads east to Orlando remains tight. On that 1,315-mile haul spot rates are up $0.03/mile to $2.82/mile.
Capacity remains tight on the West Coast. Spot rates along the entire coast are up $0.05/mile this week to an average of $2.29/mile. Capacity tightened again this week in the Los Angeles and Ontario Markets where spot rates were up another $0.03/mile to $3.49/mile (up $0.13/mile in the last four weeks).
Loads east to Atlanta from Ontario hit a new 12-month high at $3.16/mile while loads to the expanding warehouse market in Phoenix did likewise averaging $4.61/mile for the 336-mile haul. That represents an increase of $1.60/mile since February when port congestion and import volumes started to surge.
On the East Coast capacity was tight in the Richmond, VA market where load post volumes were up 8% since the previous week, pushing up spot rates by $0.09/mile to an average of $2.94/mile.
Spot rates
After increasing substantially the week prior, dry van national average spot rates remained flat last week at around $2.54/mile. Spot rates are now 11% or $0.29/mile higher than this time last year.
Of our Top 100 lanes (for loads moved), spot rates:
- Increased on 25 lanes (compared to 44 the week prior)
- Remained neutral on 31 lanes (compared to 34)
- Decreased on 44 lanes (compared to 22)
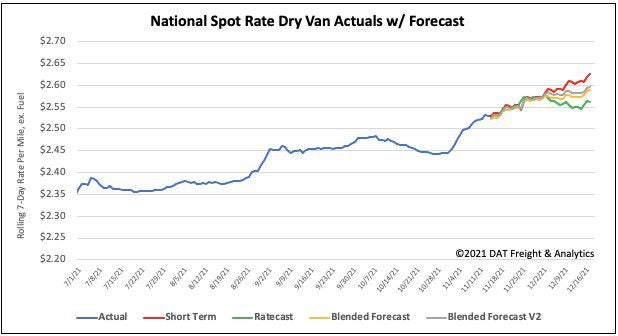
How to interpret the rate forecast:
- Ratecast: DAT’s core forecasting model
- Short Term Scenario: Formerly the pessimistic model that focuses on a more near-term historical dataset
- Blended Scenario: More heavily weighted towards the longer-term models
- Blended Scenario v2: More heavily weighted towards the shorter-term models
> Learn more about rate forecasts from DAT iQ