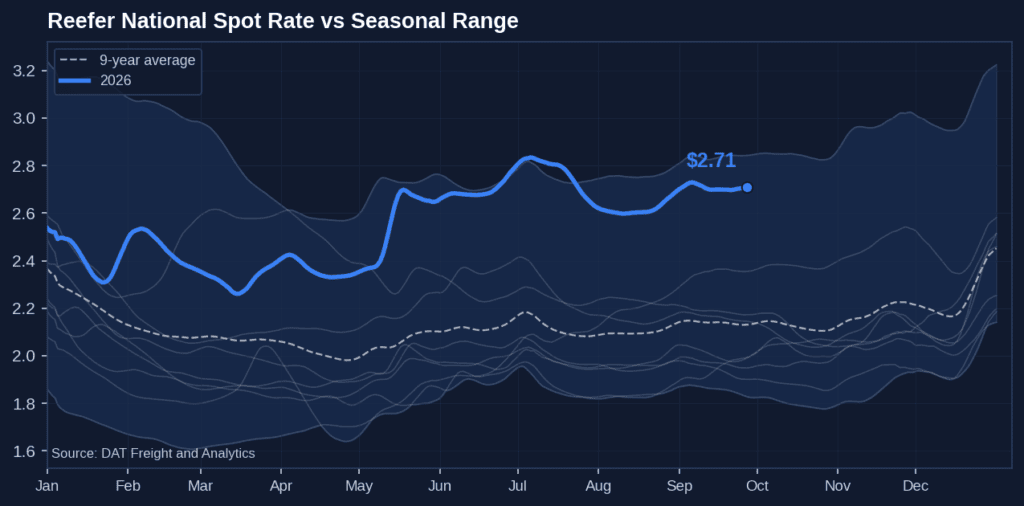
Reefer spot linehaul rates paid to carriers averaged $2.74 per mile last week, minus fuel, up 2.5%, or $0.07 per mile, from the week before. Rates climbed 32.7%, or $0.68 per mile, year over year and held 28.0%, or $0.60 per mile, above the nine-year seasonal average of $2.14 per mile, near the top of the historical range.
All rates cited are linehaul only. They exclude fuel costs and surcharges unless otherwise noted.

Get the clearest, most accurate view of the truckload marketplace with data from DAT iQ.
Tune into DAT iQ Live, live on YouTube or LinkedIn, 10am ET every Tuesday.
Bellwether states
Across the reefer bellwether states, the average outbound rate came in at $3.61 per mile last week, up 2 cents week over week and up 36.0%, or 96 cents, from a year earlier. Those states carried 40.4% of the country’s outbound reefer loads.
Regional rate trends
| Reefer — Top 10 Origins by Rate Per Mile · Week Ending October 3, 2026 | ||||
|---|---|---|---|---|
| Rank | Origin Region | Avg RPM | WoW % | YoY % |
| 1 | Upper Midwest | $3.43 | -1.4% | +38.3% |
| 2 | Great Lakes | $3.34 | +1.5% | +39.2% |
| 3 | Ohio River | $3.23 | +0.6% | +37.4% |
| 4 | Lower Midwest | $3.18 | +0.3% | +36.5% |
| 5 | Pacific Northwest | $3.07 | -3.2% | +46.2% |
| 6 | Upper Atlantic | $2.82 | +3.3% | +39.6% |
| 7 | California | $2.78 | -1.1% | +28.1% |
| 8 | Southeast | $2.36 | +0.4% | +24.2% |
| 9 | Lower Mountain | $2.35 | -1.7% | +25.0% |
| 10 | South Central | $2.14 | +0.9% | +20.2% |
The top 10 outbound reefer markets accounted for 84.1% of the loads moved last week. Upper Atlantic held up best week over week, up 3.3%, or $0.09 per mile, followed by Great Lakes at 1.5%. Pacific Northwest gave back the most, down 3.2%, or $0.10 per mile. Upper Midwest ($3.43) and Great Lakes ($3.34) posted the highest rates, and every market in the top 10 stayed well above its year-ago level, with gains ranging from roughly 20% to 46%.
Market conditions
Reefer load posts rose 11.8% week over week and 27.8% year over year, while posted trucks fell 5.7% on the week. The load-to-truck ratio climbed to 21.65 from 18.26 the week before last, against 13.48 a year ago. The move carries the fingerprint of a quarter-end push, with shipments timed to end-of-quarter deadlines and overflow routed to the spot market as contract capacity filled.
Short-term outlook

The 35-day DAT Rate Forecast projects reefer spot linehaul to hold near $2.75 per mile, against last week’s $2.74, inside a 70% confidence band from $2.66 to $2.84. That band is the widest of the three equipment types, and the projected level holds well above where the market sat a year ago.
Freight demand outlook
USDA produce rates below are for Tuesday, October 6, 2026, and week-over-week changes compare with Tuesday, September 29. They are open-market, per-load rates that shippers or receivers pay, including brokers’ fees, so they differ from the DAT linehaul rates above.
The big picture
Produce rates are climbing against a thinning load pool. Total refrigerated volume fell 2% week over week and 3% year over year, led by California, which slipped 6% and 7% as strawberry volume dropped 18% on the week, cantaloupes 13%, and grapes 5%. Washington apple and pear lanes lead the rate board at an average 72% above last year, followed by Delmarva watermelons at 50%, California at 40%, and Mexican crossings through South Texas at 38%.
California freight bound for New York firmed 9% to 16% week over week from Kern, Salinas, Santa Maria, and the South and Central district. Delmarva watermelon rates gave back 7% on average, even as Delmarva volume rose 4%.
State Scorecard
States ranked by total weekly volume. Rate figures are simple averages of each state’s lane movements.
| State | Volume w/w | Volume y/y | Avg rate w/w | Avg rate y/y |
|---|---|---|---|---|
| California | -6% | -7% | +1% | +40% |
| Texas | +6% | +2% | flat | +38% |
| Washington | flat | +5% | flat | +72% |
| Delmarva | +4% | +18% | -7% | +50% |
| North Carolina | -19% | +71% | -1% | n/a |
California
Volume through the Imperial and Coachella Valleys, Arizona, and Mexicali crossings jumped 35% week over week but stayed 16% below last year. Cucumbers led the gains, up 78%, followed by asparagus at 60%. The Arizona and Coachella production districts again recorded no volume. Inference: the winter desert vegetable deal has not started, which leaves the Salinas and Santa Maria districts carrying the leafy load.
Kern volume, almost all grapes, eased 5% on the week but ran 17% above last year. Oxnard rose 22% on strawberries, up 43%. Rates in both districts run 34% to 53% above last year on every lane, with Kern into New York the standout. Salinas-Watsonville volume slipped 2%, while Santa Maria fell 16% but stayed 14% above last year. Rates from both leaned toward New York, up 9% to 10%, while Salinas gave back 8% to 10% into Baltimore and Philadelphia.
South and Central California volume fell 15% week over week and 27% year over year, with cantaloupes down 13% and California avocados down 83% as the South District recorded no volume. Lemon volume rose 27% but ran 8% below last year. Vegetable rates firmed into New York, while citrus rates held flat on the week and remained well above 2025.
Texas
South Texas crossing volume rose 6% week over week and 2% year over year. Pharr, the largest crossing, gained 4%, and Laredo rose 11% but stayed 7% below last year. Avocados, the biggest line, rose 5% on the week, and watermelons jumped 139%. Tomatoes were the soft spot, down 5%. Rates held steady, with only Atlanta and Baltimore moving, and run well above last year.
Washington
Washington volume was flat week over week and up 5% year over year. In the Yakima and Wenatchee district, apples slipped 1% and pears 3%, while Columbia Basin volume rose 3% on dry onions. Nationwide, apple volume rose 3%. Rates held flat on every lane and run 50% to 103% above last year, led by the Los Angeles lane.
Delaware-Maryland-Virginia and North Carolina
Delmarva volume rose 4% week over week and 18% year over year, with Delaware up 16% and Maryland up 20%. Nationwide, watermelon volume fell 10% on the week and rose 36% on the year. Delmarva rates reversed the prior week’s squeeze, with every lane lower. Inference: rising volume is easing the pressure that drove those gains. North Carolina volume fell 19% on the week and rose 71% on the year, led by sweet potatoes, up 9%, while watermelons fell 65%. Rates were steady apart from Atlanta and Chicago.
New developments
- USDA printed a week-over-week rate change for Washington again, showing flat on every lane after publishing none the prior week.
- The Arizona and Coachella production districts again recorded no volume, and California avocado volume fell 83% with the South District reporting none.
- Eastern Shore Virginia volume was entirely tomatoes, which sit outside the watermelon rate basket.
- USDA now reports Kern grape volume under the San Joaquin Valley and Kern District label.
What this means for carriers, shippers, and brokers
Carriers. The best money is in Washington apples and pears, where lanes average 72% above last year, held flat on the week, and sit on steady supply. The week’s momentum is in California freight bound for New York, up 9% to 16%. Imperial and Arizona crossing volume jumped 35%, and the Seattle and Dallas lanes out of Imperial rose 8% and 6%, so those origins offer the best load availability behind a rising rate. Chicago is the weak spot, with rates out of Santa Maria, South and Central California, and Imperial down 9% to 10%. Inference: carriers with a choice of delivery market will earn more on the New York run than the Chicago run in the October 6 rates.
Shippers. Budget for rates that stay well above last year, since California lanes average 40% above 2025 and Washington lanes run 50% to 103% above, with no sign of relief in Washington or South Texas. The week did open a few places to save. California rates into Philadelphia fell 5% to 10% from Kern, South and Central, and Salinas, while the same origins into New York rose 9% to 16%, so shippers with flexibility on the receiving point should price both. Delmarva watermelon rates fell 3% to 11%, with New York down 11%, which makes the next week or two a window to cover eastern watermelon loads. South and Central citrus rates held flat but still run 35% to 67% above last year, so waiting on citrus has not paid.
Brokers. The week splits into freight to price up and freight to buy down. California loads into New York are firming fast while California volume falls, so expect carriers to hold out for more and quote those lanes with room. On the buy side, Chicago rates from Santa Maria, South and Central California, and Imperial fell 9% to 10%, and Delmarva watermelon rates fell 3% to 11%, which widens the margin where a customer’s price is already set. South Texas rates were flat on volume up 6%, so Mexican crossing freight offers the steadiest cost basis for quotes. Inference: with rates up and volume down, brokers who lock carrier commitments on New York and Washington freight early will protect margin better than those buying on the day, especially heading into Thanksgiving.