Last September, we wrote about carrier profitability and operating costs when spot rates fell and diesel came off record highs. At the time, we estimated operating costs for a typical long-haul truck operator to be around $2.01/mile – that includes wages, finance, insurance … basically everything it costs to run a truck and pay a driver and break even. Diesel was $5.00/gal, and dry van spot rates were $2.45/mile, including fuel.
These numbers don’t include sufficient profit that may be needed for an engine rebuild in the short term or a return on capital employed to fund an equipment upgrade down the road. Last year the gross profit margin would have been around $0.16/mile, which is not great, but at least carriers were surviving one of the worst periods in the history of diesel prices. Before going much further, remember there are no right or wrong answers when it comes to estimating operating costs because every truck is different. We’ve attempted to estimate what it costs a typical small fleet or owner-operator long-haul carrier to operate in the spot market.
Profits Down by Half
Today’s long haul truck costs around $1.78/mile to run with diesel at $4.08/gal, and spot rates around $2.06/mile, including fuel. The gross profit margin has dropped by 50% to $0.03/mile in just six months. Most carriers barely get by and are not generating enough profit to cover the inevitable used truck in-frame engine rebuild, let alone build sufficient reserves to upgrade equipment in coming years. It’s much worse for newer carriers who overpaid for used trucks last year and are left with trucks out of warranty, incurring higher operating costs. Their operating costs could be as much as $0.15/mile higher, especially if they were a new entrant to the industry in 2021 and paid upwards of $20,000 per power unit for liability insurance.
Could This Have Been Predicted?
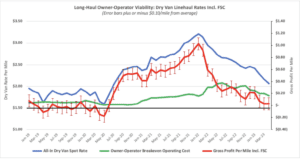
Yes, and as was the case in the 2018/19 market cycle, almost the same occurred in 2022/23, when an oversupplied freight market followed an excellent year for carriers as demand weakened. There was one significant difference in the last 12 months, though. Carriers were coming off one of the most profitable periods in recent history, where they benefited from record-high spot rates starting in 2020 and continuing through all of 2021. At the same time, diesel prices were much lower, resulting in an unprecedented 20-month period spanning August 2020 to March 2022, where carriers made record profits. Just ask any shipper who received double-digit rate increases for six straight quarters. Figure 1 below graphically shows this period, contrasting 2019 and 2023 as bookends to this incredible period of profitability. In 2019, the average gross profit margin was -$0.02/mile for the year.
As is always the case, rates move up and down along with supply and demand, and the last market cycle was no different. DAT Freight & Analytics warned carriers throughout the second half of 2021 that the good times won’t last. Here’s what we also said six months ago: “What 2023 brings is another story, and owner-operators and small fleets would be well-advised to ensure they have the first three months’ truck and trailer payments for 2023 in the bank before 2022 ends.” That was great advice, given how tough things have been so far this year.
Operating Costs and Profit Margins Vary
Well, that depends on who you ask, plus a range of other factors, including the type of business (for-hire, private fleet, power-only, etc.), length of haul, fleet size, truck and trailer type, customer base, accounting methods, debt levels, and commodity hauled, to name just a few. It’s complicated no matter who you ask. What’s important to remember is there is no right or wrong answer.
Key assumptions in this model
The trucking operation we’ve based this analysis on is a typical owner-operator long-haul dry van operation covering 100,000 loaded and 15,000 empty miles annually, truck and trailer financed at current interest rates, annual wages/profit target of $64,000 ($0.55/mile), operates 50 weeks/year, speed limited at 65mph, buys fuel at retail prices and averages 6.5mpg. We’ve attempted to approximate the typical operating costs for a long-haul operator with significant exposure to market volatility in the spot market, i.e., the most vulnerable to record high diesel prices and fluctuating spot rates.
What should carriers be looking at during the second quarter?
The first quarter, “The Quiet Season,” would always be quieter than expected following the supply chain disruptions that continued well into 2022. DAT expects the second quarter to be pivotal and show signs of higher demand and seasonality emerging. Produce, planting, construction, and importing are seasonal forces that typically occur during this quarter – we’ll be watching these signals closely and reporting on them as they emerge. Carriers must control operations costs, slow down, idle less, and make good lane selection and rate negotiation decisions.
Until truckload demand improves, spot rates bottom out, and diesel is sustained below $4.00/gal; this quarter could be one of the most important in recent history.
Figure 1: Long-haul owner-operator viability analysis