By Dean Croke and David Wardlaw
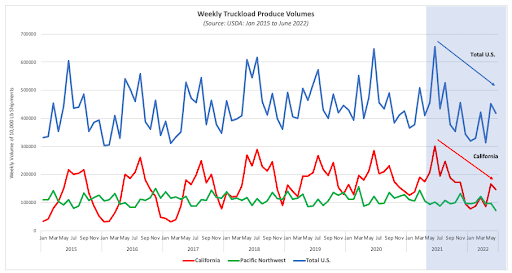
In a typical year, the United States West Coast accounts for almost 60% of produce hauled by truckload carriers. California, at 34% of annual volume, leads the way, followed by the Pacific Northwest region at 24%. In most years, summer produce volumes in these regions, especially California, are normally so high that they drive up national truckload rates for reefer and dry van carriers peaking around July 4. That didn’t happen this year, with June national truckload volumes down by around 15% compared to the previous year.
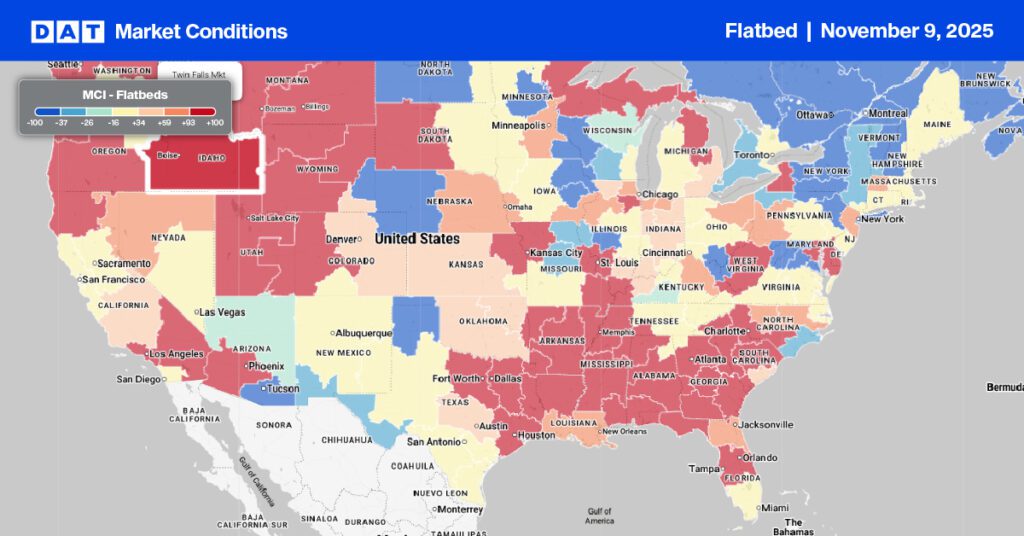
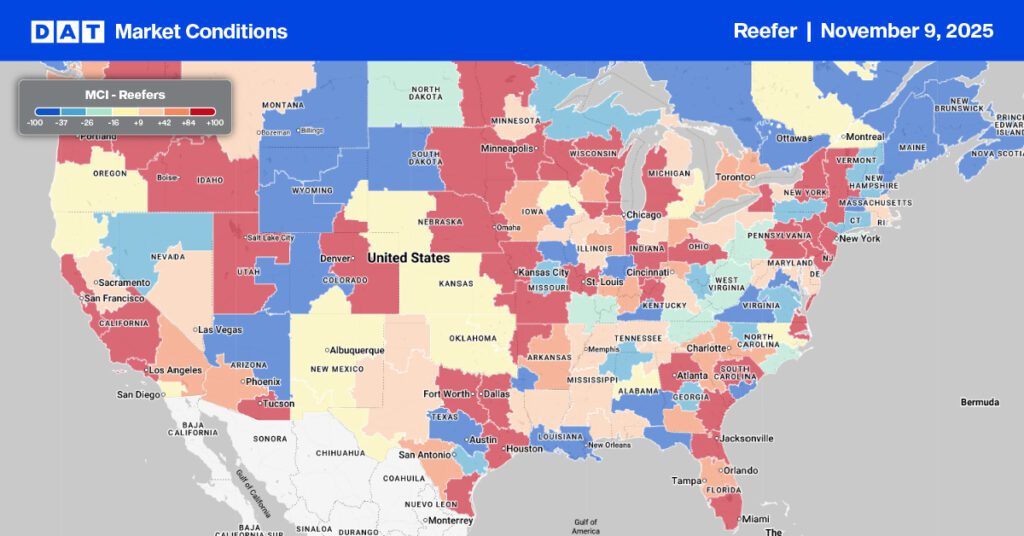
Unlike in other years, where we see seasonal spot rate and shipping volume spikes resulting in market imbalance throughout the country, this year’s peak was more like a speed bump. In a normal year, DAT would expect to see reefer spot rates climb by $0.12/mile in June alone; this year, they dropped by the same amount.
Get the clearest, most accurate view of the truckload marketplace with data from DAT iQ.
Tune into DAT iQ Live, live on YouTube or LinkedIn, 10am ET every Tuesday.
At the end of June, truckload volumes of produce in California were around 38% lower than the previous year, and whilst there’s still crop volume to be reported by growers, the season’s total so far looks weak compared to prior years (see figure below). Of greater concern for truckload carriers is the longer-term trend the California produce season points to, and that’s the multi-year drought the state is experiencing.
How serious is the drought on produce farmers in California?
DAT Freight & Analytics took a deep dive into the Golden State’s water problem and found some alarming statistics that point to potentially lower ongoing truckload volumes. Of course, there’s always the possibility the heavens will open and dump enough rain to end the drought and fill the state’s reservoirs. In the interim, there’s talk of stricter water restrictions, desalination plants and drought-resistant crops, but none of that will solve the immediate problem of lower produce volumes this year.
On top of long-term climate changes resulting in a hotter state where 11 of the 20 warmest years in California have occurred since 2000, this year, unusual weather patterns and warmer temperatures, especially at night (reducing the ability of plants to recover from daytime heat), haven’t helped either. Currently, California’s average temperature is 3.5℉ above the 20th-century average resulting in an 8% increase in crop water demand. Abnormally hot temps in April, upwards of 80℉, followed by a harsh cold snap, killing much of the new growth in Spring, has also added to a much slower start to the 2022 produce season.
Some crops have been impacted more than others in 2022.
Based on data from the United States Department of Agriculture (USDA):
- This year’s rice crop will be the state’s smallest in at least 50 years at 250,000 acres, down from half a million acres.
- Tomato production estimate continues to decrease from 12.2 million tons in January to 11.7 million tons in June.
- The grape crop is about 30% of typical volumes.
- The total orange box forecast has dropped by 2.3 million to 49 million boxes.
- Grapefruit production has dropped from 4.1 million to 4 million boxes.
- Tangerine/ Tangelo production has dropped by 1 million to 20 million boxes.
- The lemon forecast has remained unchanged at 23 million boxes.
- The sweet cherry crop is down 63% year-to-date.
- Almond production decreased to 1,179,000 metric tons from 1,322,00 in 2021 and 1,413,000 in 2020.
How are this impacting West Coast Reefer haulers?
Whilst the national average all-in reefer spot rate sits around $3.00/mile, reefer carriers in California are fairing better than the national average at $3.24/mile for outbound long-haul loads. Produce-specific carriers in the major CA growing regions are doing even better, averaging more than $1.00/mile at $4.45/mile last week. That’s around $0.34/mile higher than the previous year.
Within the averages, though, are a wide range of spot rates depending on truck availability, lead time, length of haul, and volume. Take the ultra-long-haul lane between Fresno in the heart of California’s produce-growing region and Hunts Point, NY, home to the largest produce market on the East Coast. All-in spot rates on that lane are averaging $2.81/mile this week, which is 26% lower than the previous year. On the high-volume lane to Chicago, spot rates are 23% lower y/y at $2.73/mile, while loads north to Seattle are just 6% lower y/y.