Here’s something that might surprise you: Spot market truckload volumes were 7% higher in the first six months of 2019 than they were in the first half of 2018, according to the DAT Truckload Volume Index. The index reflects the change in the actual number of loads moved each month, based on contributions to DAT RateView. But for many trucking companies, this hasn’t felt like an “up” year.
For one, there’s been a lot more trucks available this year, so load posts on the DAT Load Board are down in 2019 compared to 2018. Freight brokers and shippers routinely had trouble securing capacity last year, with rates hitting all-time record highs for all three major equipment types. To avoid the high prices they paid in 2018, shippers placed a higher priority on securing capacity ahead of time this year.
Yet, activity on the spot market has still been elevated. Below were the 10 markets that were the busiest for outbound dry van, refrigerated van and flatbed freight.
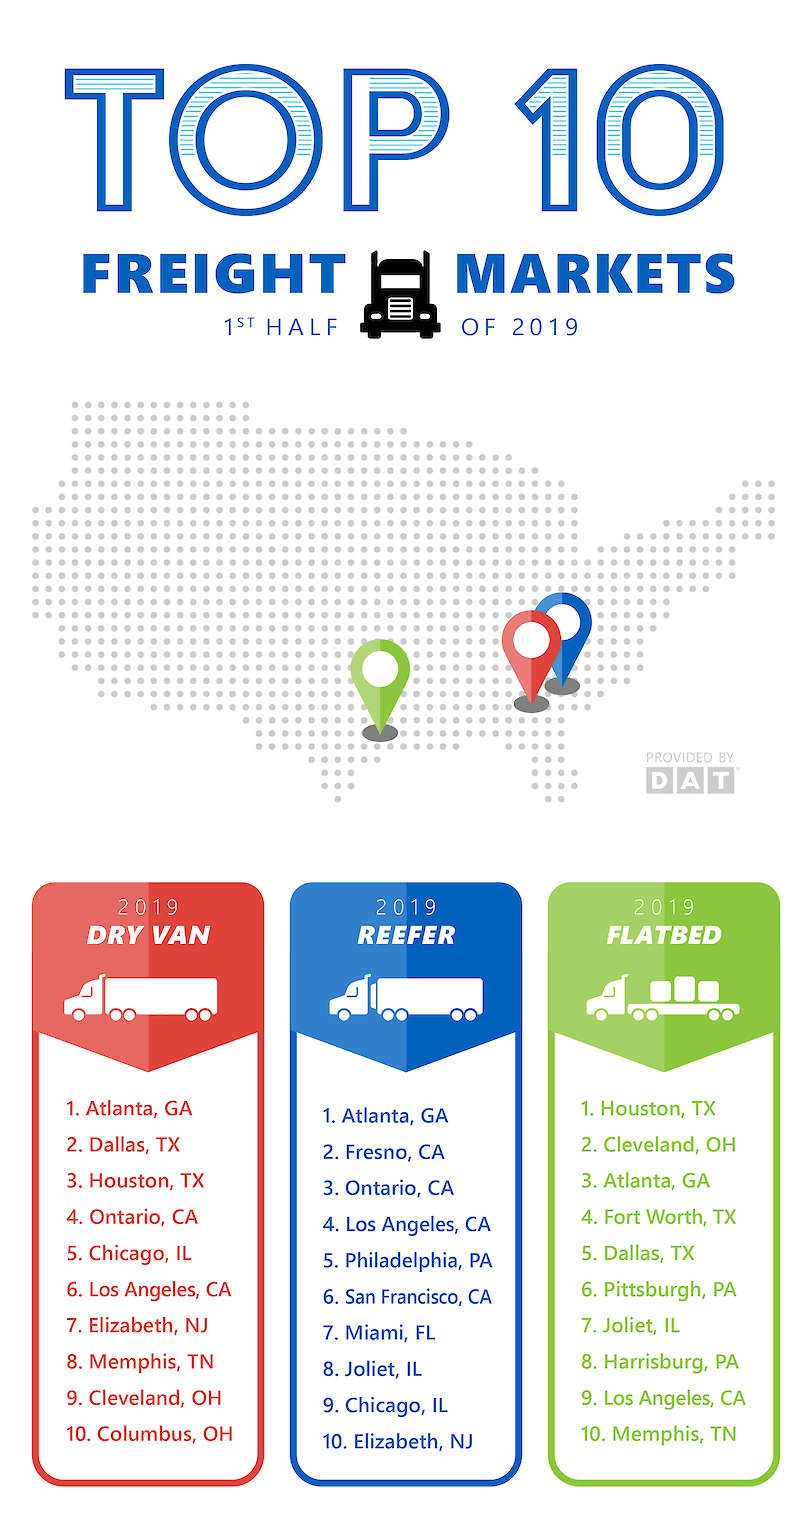
Rankings based on transaction data in DAT RateView
Find loads, trucks and lane-by-lane rate information in DAT load boards, including rates from DAT RateView.