Truckload demand got a boost at the end of July, but that urgency slowed by the start of August. That led to a lot of mixed results on the spot market last week.
Volumes in key markets stabilized van rates, with most lanes seeing relatively small changes in rates. Volumes rose 13% in Stockton,CA, but while Dallas saw a 5% drop. Los Angeles and the west cooled down, but further along the supply chain, things picked up in Memphis, Buffalo and Philadelphia.
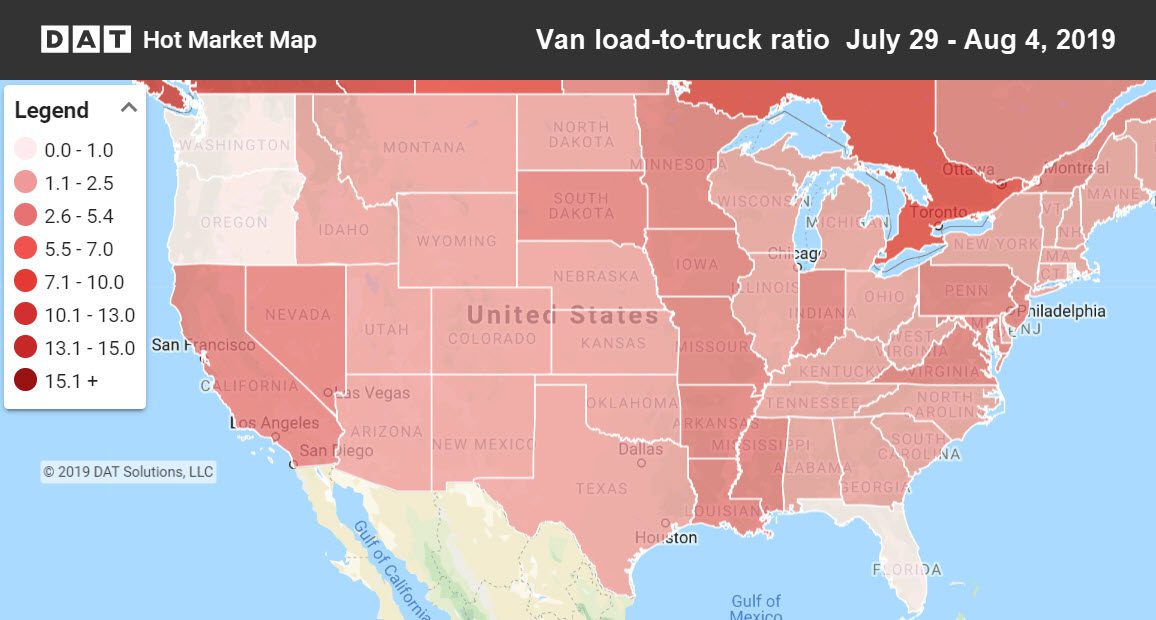
Last week vans were hardest to come by in California, Nevada and states bordering the Mississippi River. Hot Market Maps are available in the DAT Power load board and DAT RateView.
Rising
Pricing improved out of Philadelphia and Buffalo last week. Outside of the Northeast, Memphis also saw a modest increase.
- Philadelphia to Boston also up 15¢ to $3.54/mi
- Philadelphia to Buffalo rose 15¢ to $2.34/mi
- Buffalo to Allentown, PA, gained 13¢ to $2.96/mi
- Memphis to Indianapolis climbed 12¢ to $2.30/mi
Falling
Los Angeles reversed direction, as freight faded late in the week. In the top 100 lanes, there weren’t many significant decreases.
- Los Angeles to Denver dipped 9¢ to $2.62/mi
- Charlotte to Buffalo declined 7¢ to $2.32/mi
- Dallas to Memphis went down 8¢ to $1.32/mi
Find loads, trucks and lane-by-lane rate information in DAT load boards, including rates from DAT RateView.


