The May 2025 Logistics Manager’s Index (LMI) rose to 59.4, up 0.6 points from April, marking two months of expansion and significantly exceeding last year’s figures. Escalating costs drove the increase, despite a slowdown in inventory movements. Inventory Costs surged to 78.4, the highest since October 2022, creating a large gap between inventory metrics, indicating costly, stationary inventories. Warehousing Capacity remained stagnant at 50.0, while Warehousing Prices slightly decreased to 72.1 due to limited space. Transportation metrics were stable, with Transportation Capacity at 54.7, Utilization at 52.6 (a low since November 2023), and Prices at 63.1.Get the clearest, most accurate view of the truckload marketplace with data from DAT iQ.
Tune into DAT iQ Live, live on YouTube or LinkedIn, 10am ET every Tuesday.
The Transportation Capacity Index decreased .5 points to 54.7 percent in May 2025. With this small drop, the Transportation Capacity falls to a level that is 2.6 points lower than 1 year ago and 14.6 points from two years ago. As such, while the Transportation Capacity index remains in the slight expansion territory, it is relatively subdued when compared to seasonal data for the last two years.
Transportation Capacity fell slightly to 54.7% in May 2025, down from last year and significantly lower than two years ago, though still indicating slight expansion. Upstream capacity is stable at 50.0, while Downstream is much higher at 65.3. Future capacity is projected to remain stable overall at 50.0, but tightening Upstream (46.2) and looser Downstream (59.7) conditions are expected to persist.
Load-to-Truck Ratio
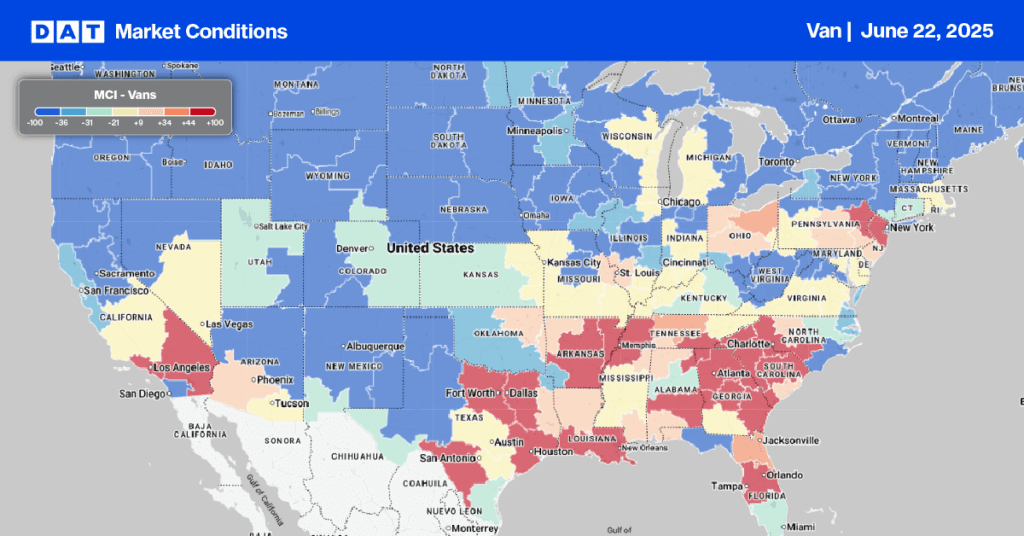
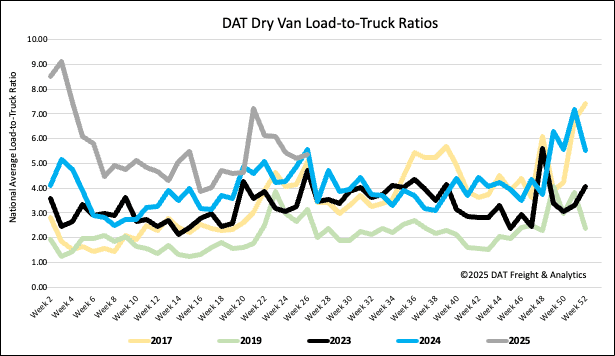
Load post volume saw a 2% decrease last week, likely due to Juneteenth. This year, the holiday fell on a Thursday, potentially creating a four-day weekend for many, unlike last year when it was on a Wednesday. Carrier equipment posts also dropped by 5% week-over-week. As a result, the dry van load-to-truck ratio experienced a slight increase, reaching 5.34.
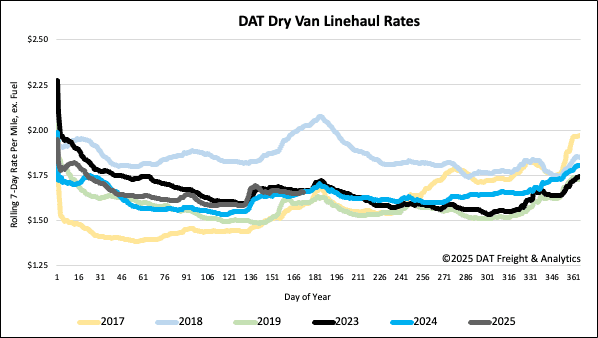
Linehaul spot rates
Dry van linehaul spot rates averaged slightly over $1.67 per mile last week, a decrease of $0.01 per mile following three weeks of relative stability. This rate mirrors the same period last year and is $0.01 higher than in 2023.
For DAT’s top 50 lanes, based on load volume, the average rate was $1.99 per mile. This represents a $0.03 per mile decline from the previous week but remains $0.32 higher than the national 7-day rolling average spot rate.
In the 13 key Midwest states, which contribute 45% of national load volume and often indicate national trends, spot rates saw a $0.02 per mile reduction. This drop occurred despite a 1% rise in outbound load volume within the region. Carriers operating in these states earned an average of $1.85 per mile, surpassing the national 7-day rolling average by $0.18.