In Q2 2025, the U.S. Bank Freight Payment Index showed the first signs of recovery in the freight market after nearly three years of contraction. National shipment volume rose 2.4% quarter-over-quarter (QoQ), and spending increased 1.2%, marking a notable shift in momentum. However, year-over-year (YoY) comparisons still reflect a weakened market, with shipments down 9.8% and spending down 4.9% compared to Q2 2024. Despite this, the YoY shipment decline was the smallest since Q3 2023, suggesting the freight market may be stabilizing. The Northeast and West regions showed particular strength, with YoY gains in shipments and spending, while the Southwest led in QoQ shipment growth.
Get the clearest, most accurate view of the truckload marketplace with data from DAT iQ.
Tune into DAT iQ Live, live on YouTube or LinkedIn, 10am ET every Tuesday.
Regionally, performance was mixed but trended positively. The Northeast posted consistent growth supported by housing starts and auto demand, while the West benefited from increased port and inventory activity. In contrast, the Southeast and Midwest showed modest QoQ gains but remained negative YoY. The Southwest saw the strongest QoQ growth in shipments (+6.7%) but still experienced a steep YoY decline (‑26%). These mixed signals indicate that while the freight market may be beginning to rebound, broader recovery remains fragile and influenced by economic uncertainty, consumer demand, and geopolitical risks.
Load-to-Truck Ratio
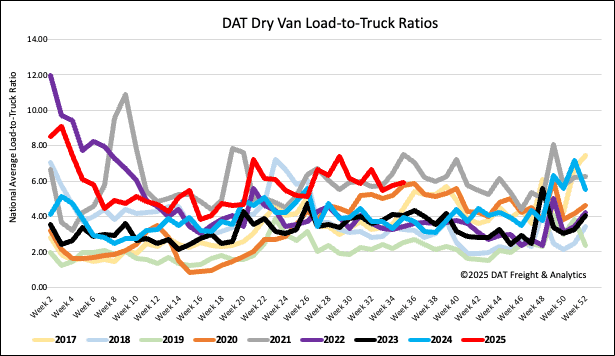
Last week, dry van load posts rose by 2% week over week and 26% year over year. This figure was also 12% above the long-term average for Week 34. Concurrently, spot market capacity held steady with no change in carrier equipment posts. As a result, the dry van load-to-truck ratio remained largely consistent at 5.93.
Linehaul spot rates
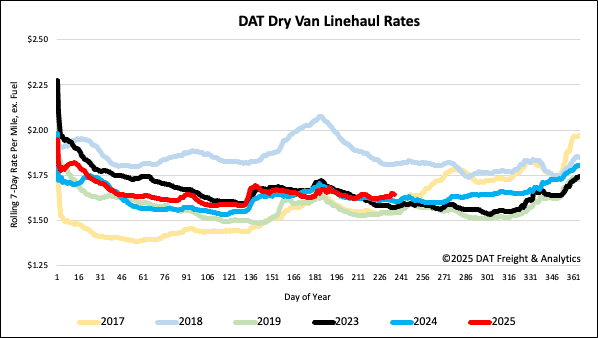
Dry van linehaul spot rates remained unchanged last week, averaging $1.65 per mile, $0.04 higher than the same time last year and $0.07 higher than in 2023.
The average rate for DAT’s top 50 lanes by load volume remained unchanged at $1.99 per mile for the fourth week and $0.34 higher than the national 7-day rolling average spot rate.
In the 13 key Midwest states, which represent 46% of national load volume and often indicate future national trends, spot rates were up a penny on a flat volume of loads moved. Carriers in these states earned an average of $1.87 per mile, which is $0.22 above the national 7-day rolling average.