Every Halloween, about 41% of Americans carve a fresh pumpkin for Halloween. The USDA estimates that around 1 billion pounds of pumpkins are produced in the U.S. during the season, with a significant share devoted to ornamental use like jack-o’-lanterns. In truckload terms, that’s the equivalent of almost 24,000 loads!Get the clearest, most accurate view of the truckload marketplace with data from DAT iQ.
Tune into DAT iQ Live, live on YouTube or LinkedIn, 10am ET every Tuesday.
Halloween spending is projected to hit a record $13.1 billion this year, up from $11.6 billion last year, with 73% of consumers celebrating, according to the National Retail Federation (NRF). Popular activities include handing out candy (66%), dressing up (51%), and decorating (51%). Candy ($3.9B), costumes ($4.3B), and decorations ($4.2B) are top purchases. Per-person spending is $114.45. Early shopping is common, with 49% starting by September, driven by fall anticipation (44%) and love for Halloween (37%).
Discount stores (42%) are the most popular shopping destination. Online searches (37%) inspire costumes and decorations. Children’s costumes (Spider-Man, princess, witch) are expected to generate $1.4 billion, adult costumes (witch, vampire, pirate) $2 billion, and pet costumes (pumpkin, hot dog, bumblebee) $0.86 billion.
Dry Van Market Watch
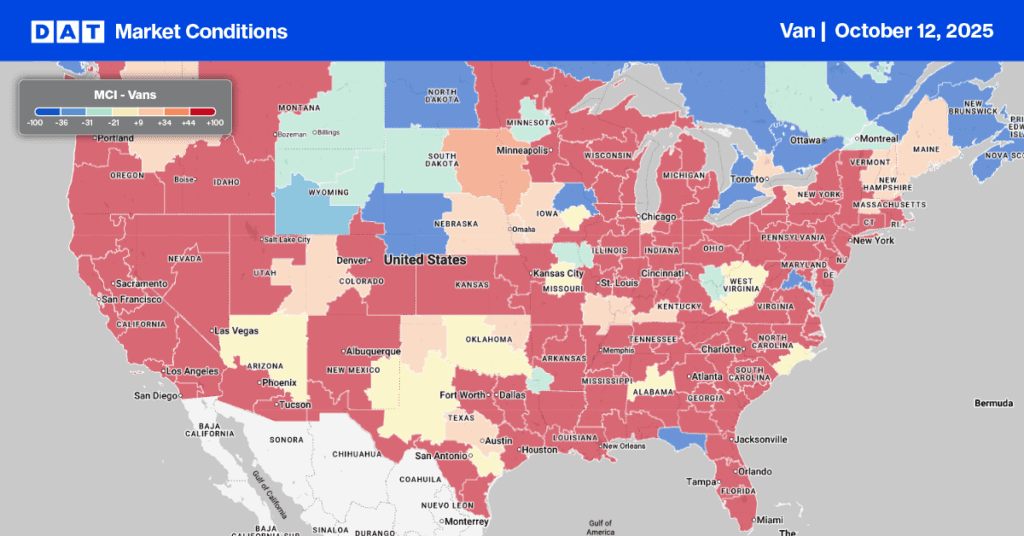
Last week, the dry van load-to-truck ratio decreased to 6.29, as load posts decreased by 16% while equipment posts remained mostly unchanged. Despite the national decrease in volume, freight brokers faced ongoing capacity challenges along the southern border where Immigration and Customs Enforcement (ICE) is very active.
In the Laredo freight market, outbound load posts were up for the fourth week, increasing by 9% week over week for loads to San Francisco. On that lane, spot rates rose by $0.08 per mile, paying carriers an average of $1.36 per mile, $0.12 higher than last year.
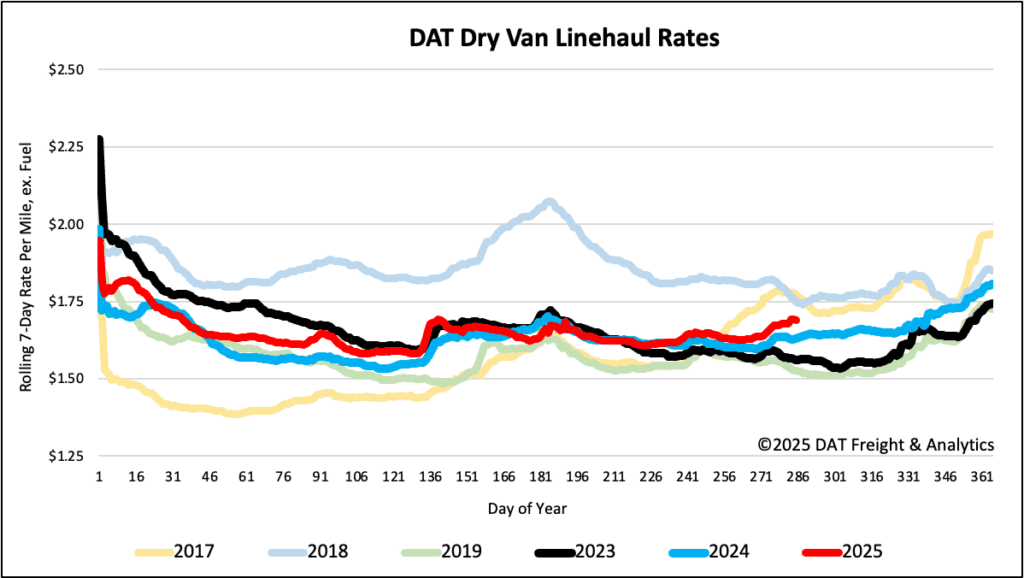
National linehaul spot rates
Dry van linehaul spot rates remained unchanged last week, averaging $1.70 per mile, $0.06 higher than the same time last year and $0.13 higher than in 2023.
The average rate for DAT’s top 50 lanes by load volume decreased by $0.01 per mile last week, averaging $2.00 per mile and $0.30 higher than the national 7-day rolling average spot rate.
In the 13 key Midwest states, which represent 46% of national load volume and often indicate future national trends, spot rates were up $0.01 per mile. Carriers in these states earned an average of $1.93 per mile, which remained $0.23 above the national 7-day rolling average.