U.S. shippers are increasingly turning to private, in-house truck fleets to transport goods, despite favorable rates in the for-hire market. Growth in private fleets, although slowing compared to peak levels during the COVID-19 pandemic, rose by 11.7% year-over-year in 2024. Bill Cassidy, Senior Editor Trucking at the Journal of Commerce notes Industry experts attribute this trend to the need for better control over supply chains and truck capacity, aided by advancements in technology. Major carriers like Schneider National have noted a significant shift from a near-equal balance of private and for-hire fleets to a current estimate of 55% private and 45% for-hire, driven by rising fleet operating costs.
Get the clearest, most accurate view of the truckload marketplace with data from DAT iQ.
Tune into DAT iQ Live, live on YouTube or LinkedIn, 10am ET every Tuesday.
Furthermore, the use of private fleets is extending beyond just outbound freight delivery; shippers are now collaborating more with vendors to enhance inbound logistics. Data from the National Private Truck Council indicates that private fleets handled 43% of inbound freight in 2024, an increase from previous years. This trend reflects a deeper partnership between shippers and their suppliers to optimize transportation processes. The growing reliance on in-house fleets illustrates the shifting dynamics of the trucking industry, with companies seeking to maintain control over the logistics of their supply chains.

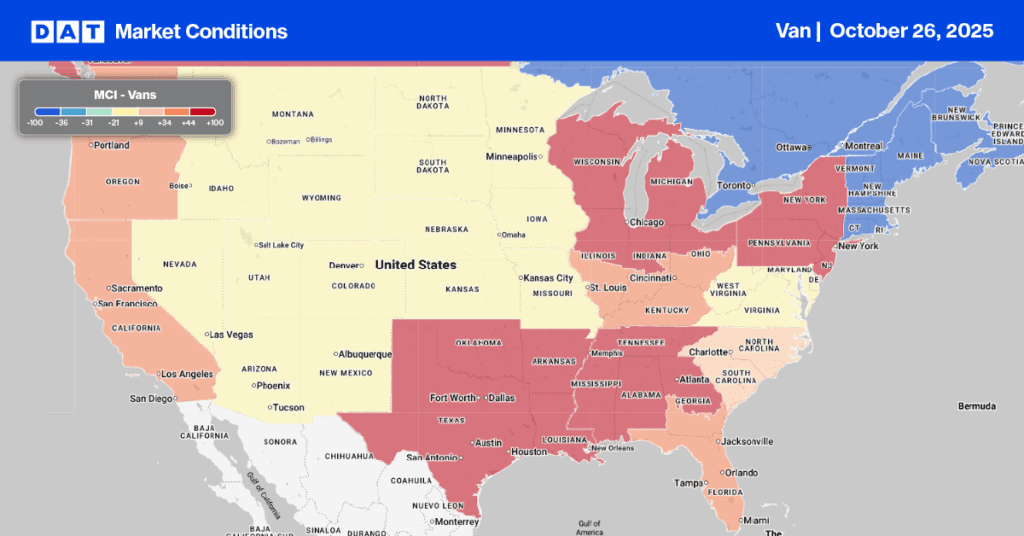
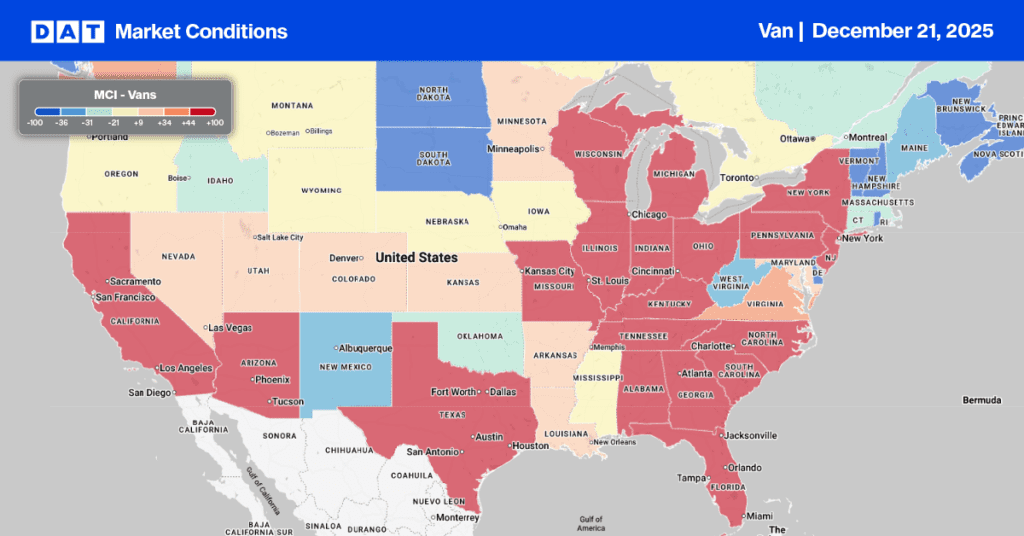
Dry Van Market Conditions Index
Last week, the dry van load-to-truck ratio climbed to 6.23. This increase was driven by a slight 2% rise in load posts and a 6% decrease in equipment posts. The Pacific Northwest (PNW) continues to present capacity challenges for DAT’s freight broker network, with load post volumes increasing by 17% last week, and by 60% in the Pendleton market. Consequently, dry van spot rates saw a $0.03 per mile increase.
Last week, Lakeland, FL, saw a 12% increase in load posts, contributing to a 23% rise over the past month. This activity coincides with increased Immigration and Customs Enforcement (ICE) operations at Florida scale houses. Meanwhile, in Oklahoma, where ICE has recently been targeting foreign-born nationals operating commercial motor vehicles on Interstate 40, continues to experience tighter capacity and a 42% surge in load posts last week, pushing outbound spot rates up by $0.03 per mile to $1.64.
National dry van linehaul spot rates

Dry van linehaul spot rates increased by $0.02 per mile last week, averaging $1.72 per mile, $0.06 or 4% higher than the same time last year and $0.16 higher than in 2023.
The average rate for DAT’s top 50 lanes by load volume remained unchanged for the second week, averaging $2.00 per mile and $0.28 higher than the national 7-day rolling average spot rate.
In the 13 key Midwest states, which represent 46% of national load volume and often indicate future national trends, spot rates increased by $0.02 per mile to $1.95 per mile, which was $0.23 above the national 7-day rolling average.


