The seasonally adjusted Trucking Ton-Mile Index (TTMI), a key benchmark for trucking demand, registered a noticeable downturn in October, falling 0.8% month-over-month. This decline was largely driven by weakness in the wholesale trade sector, particularly machinery. Of greater significance, the index was unchanged year-over-year from October 2024, marking the first time the TTMI has failed to show an annual increase. Looking ahead to December, while a slight increase over October is possible due to strength in food manufacturing, this will likely be offset by expected weakness in wood products and paper production. This near-term forecast suggests demand will be neutral to perhaps up 0.3% year-over-year, which helps explain the capacity tightening observed in December, when holiday sales coincided with an estimated 3-5% reduction in available trucks.
Get the clearest, most accurate view of the truckload marketplace with data from DAT iQ.
Tune into DAT iQ Live, live on YouTube or LinkedIn, 10am ET every Tuesday.
The current trend indicates that a sustained, extended increase in trucking freight rates is unlikely without significant improvement in core demand conditions. With the TTMI analysis pointing to limited increases in overall freight volume throughout the first half of 2026, carriers should expect capacity to remain relatively loose. The market is not yet signaling the kind of demand surge required to push rates upward. Trucking companies must factor this cautious outlook into their planning, anticipating stable but not robust freight volumes in the coming months.
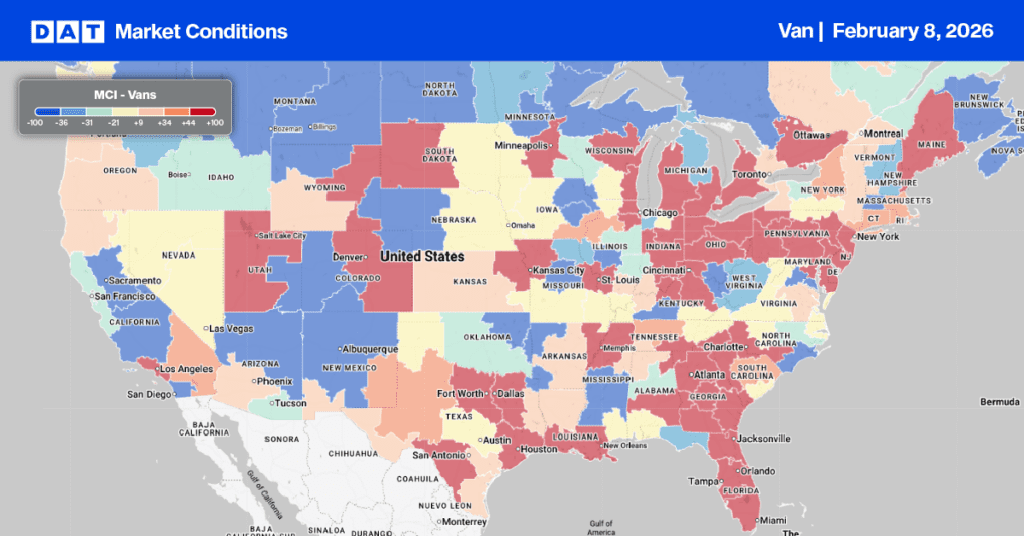
Dry Van Market Conditions Index
Dry van capacity was significantly constrained for a second consecutive week due to the impact of Winter Storms Fern and Giana, coupled with sub-zero temperatures across the Midwest, Plains, and Southeast. Although load post volumes saw a modest increase of just under 3% at month-end, they remain roughly double the volume compared to the previous year. With equipment posts rising by just over 2%, the national load-to-truck ratio ultimately settled at 10.65 last week.
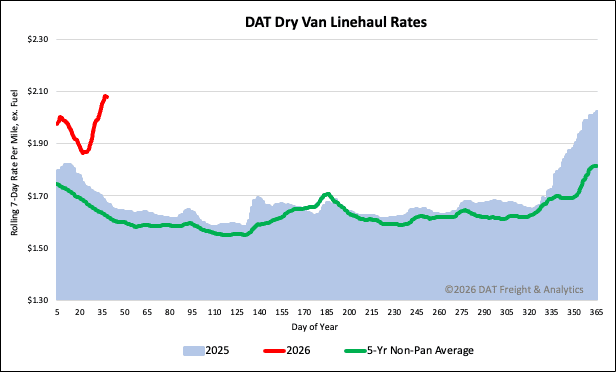
National dry van linehaul spot rates
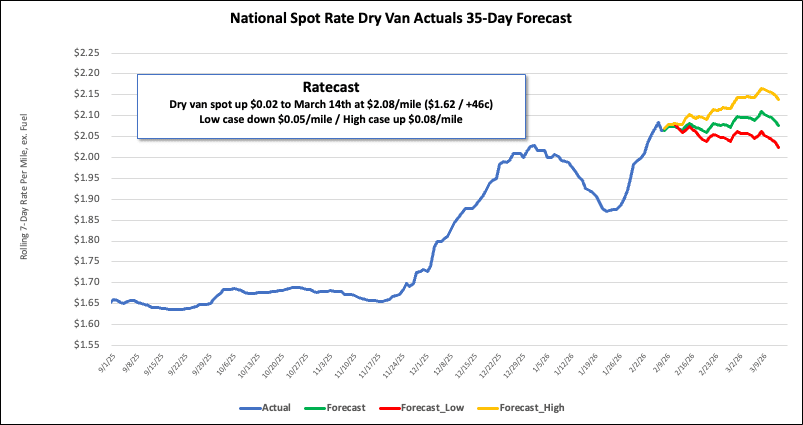
As the effects of Winter Storms Fern and Gianna continue to ripple through the East Coast freight network, national dry van linehaul spot rates continue to surge, increasing by $0.07 per mile to $2.08 per mile last week.
The current rate is notably stronger than previous years, standing $0.41 (25%) higher year-over-year. Excluding the pandemic years, it also exceeds the 5-year average by $0.46 (22%).
The average rate for DAT’s top 50 lanes by load volume increased by $0.05 per mile last week, averaging $2.32 per mile and $0.25 higher than the national 7-day rolling average spot rate.
In the 13 key Midwest states, which represent around 45% of national load volume and often indicate future national trends, spot rates increased by $0.19 per mile to $2.58 per mile, which was $0.50 above the national 7-day rolling average. The concentration of heavy manufacturing—including construction, agriculture, steel, and aerospace/defense major players—across 13 key states (KY, VA, MO, IN, AR, OH, KS, MD, OK, TN, PA, IL, NC) consistently drives high-volume freight demand. This demand is for both inbound raw materials and outbound finished goods.
Notably, load movement surged 55% last week as the month ended, a figure 22% higher than the same period last year. This surge, combined with a higher ISM PMI reading last week, suggests that domestic manufacturing is beginning to drive an improvement in truckload demand.