Trucking activity in the United States posted its second consecutive monthly gain in December, with the American Trucking Associations’ advanced seasonally adjusted For-Hire Truck Tonnage Index rising 0.4% month-over-month to reach 112.9. While the back-to-back increases offer some encouragement, the index remains at depressed levels following sharp declines of 2.7% combined in September and October. On a year-over-year basis, tonnage was up just 0.9% compared to December 2024, marking a modest improvement after two months of year-over-year declines.
Get the clearest, most accurate view of the truckload marketplace with data from DAT iQ.
Tune into DAT iQ Live, live on YouTube or LinkedIn, 10am ET every Tuesday.
The bigger picture reveals an anemic year for freight volumes. For all of 2025, tonnage increased just 0.1% compared to the 2024 average—the first annual gain since 2022, but barely registering as growth. ATA Chief Economist Bob Costello pointed to ongoing weakness in manufacturing and construction activity as the primary culprits suppressing freight demand throughout much of the year. The fourth quarter was particularly weak, with the index falling 1.8% from the third quarter—the steepest sequential quarterly drop since Q2 2023. For trucking companies hoping for a robust freight recovery, these numbers underscore that the market remains in a prolonged soft patch with demand struggling to gain meaningful traction.
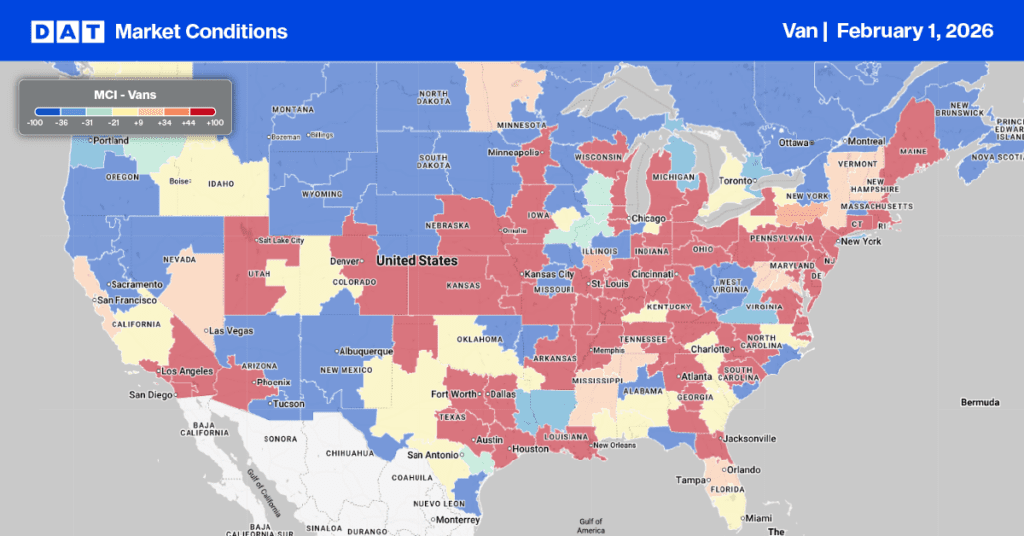
Dry Van Market Conditions Index
Winter Storm Fern caused a rapid tightening of dry van capacity last week, leading to a near-doubling of the national load-to-truck ratio, which settled at 11.62. This surge was driven by a 55% week-over-week spike in load posts and a corresponding 19% drop in available truck posts.
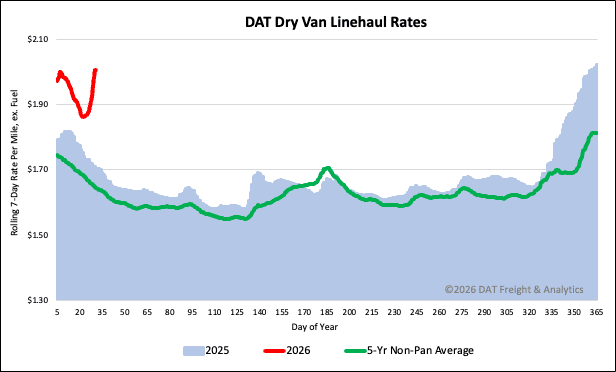
National dry van linehaul spot rates
Last week’s Winter Storm Fern brought the entire freight network to a standstill, causing dry van linehaul spot rates to surge. With impassable roads east of the Mississippi, available capacity tightened rapidly. The national average rate jumped by $0.11 per mile to $2.01 per mile—the largest single-week increase in over three years. However, this increase was less severe than the $0.14 per mile spike seen during the 2021 “Polar Vortex” event caused by Winter Storms Uri and Viola.
The current rate is notably stronger than previous years, standing $0.30 (18%) higher year-over-year. Excluding the pandemic years, it also exceeds the 5-year average by $0.36 (18%).
The average rate for DAT’s top 50 lanes by load volume increased by $0.09 per mile last week, averaging $2.27 per mile and $0.26 higher than the national 7-day rolling average spot rate.
In the 13 key Midwest states, which represent around 45% of national load volume and often indicate future national trends, spot rates increased by $0.13 per mile to $2.39 per mile, which was $0.38 above the national 7-day rolling average.