America’s road congestion problem isn’t getting better — and the trucking industry is paying the price. The American Transportation Research Institute (ATRI) just released its 15th annual Top 100 Truck Bottlenecks list, and the headline finding is a changing of the guard at the top: for the first time ever, the interchange of I-294 and I-290/I-88 in Chicago has claimed the number one spot, dethroning Fort Lee, New Jersey’s I-95/SR 4 interchange, which had long held that dubious distinction. Using terabytes of real-world truck GPS data from 2025, ATRI ranked more than 325 freight-critical locations across the national highway system. The results underscore a hard truth for carriers and shippers alike — congestion delays are the equivalent of 436,000 truck drivers sitting idle for an entire year, and conditions deteriorated further in 2025, with average rush hour truck speeds falling to 33.2 MPH, nearly 3 percent slower than the year prior.
Get the clearest, most accurate view of the truckload marketplace with data from DAT iQ.
Tune into DAT iQ Live, live on YouTube or LinkedIn, 10am ET every Tuesday.
The top 10 list reads like a geography lesson in America’s most freight-intensive metros. Chicago and its surrounding interchange system now sit at the top, but Atlanta dominates the middle of the list with three separate entries — I-285 at I-85 (North), I-75 at I-285 (North), and I-20 at I-285 (West). Houston contributes two locations, with backups on both I-45 and I-10 at the I-69/US 59 junction. Nashville, Cincinnati, and McDonough, Georgia round out the top 10. For shippers routing freight through the Midwest or Southeast, or carriers operating in and around these metro areas, the data confirms what drivers already know: these corridors consistently burn hours, inflate costs, and compress delivery windows in ways that ripple across the entire supply chain.
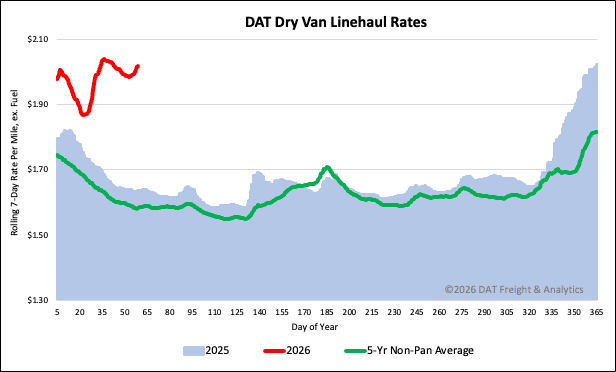
National dry van linehaul spot rates
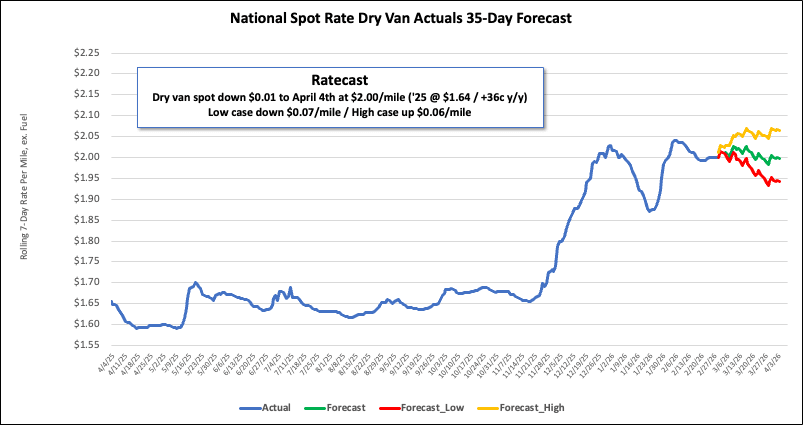
Dry van capacity continued to loosen for the fourth consecutive week, leading to a further decrease in the national 7-day average dry van linehaul spot rate. Excluding fuel, the rate fell another $0.02 per mile, closing the week at $2.02 per mile.
Even with this recent decline, the rate is still elevated. It is currently $0.38 (24%) above the rate recorded a year ago and, when excluding the pandemic-affected years, it remains $0.44 (22%) higher than the five-year average.
The average rate for DAT’s top 50 lanes by load volume also decreased by $0.01 per mile last week, averaging $2.25 per mile and $0.23 higher than the national 7-day rolling average spot rate.
In the 13 key Midwest states, which represent around 47% of national load volume and often indicate future national trends, spot rates decreased by $0.03 per mile to $2.45 per mile, which was $0.43 above the national 7-day rolling average.
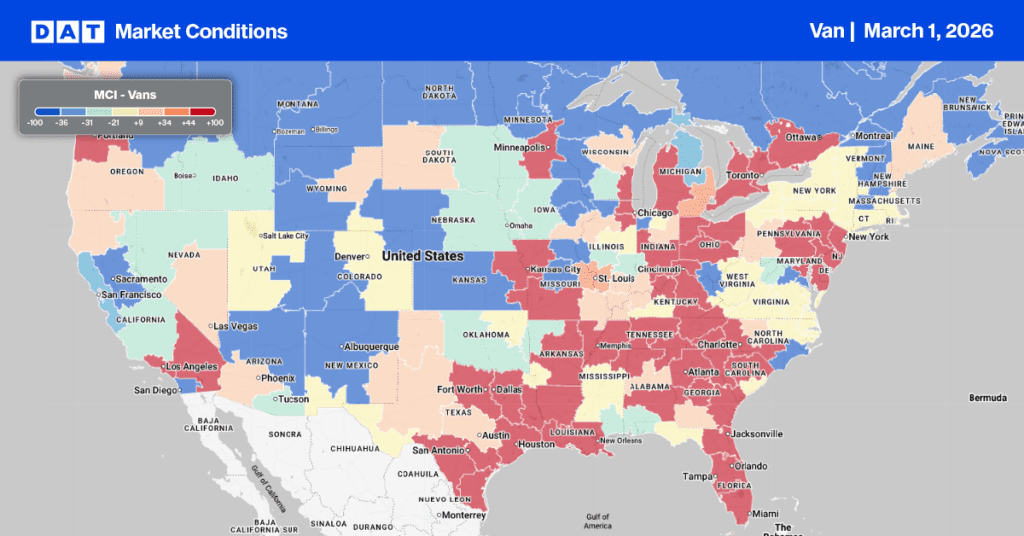
Dry Van Market Conditions
After three consecutive weeks of decline, dry van load post volumes got a boost from end-of-month shipments, increasing by 2% increase last week. Volumes remain significantly elevated, sitting 56% higher than last year and an impressive 97% above the 10-year average (excluding the pandemic-affected years of 2021 and 2022). With equipment posts holding steady, the national load-to-truck ratio settled at 8.59.