Few data points cut through economic noise quite like RV sales. To buy a recreational vehicle, a consumer needs disposable income, access to credit, confidence in their job outlook, and willingness to commit to a large discretionary purchase — making RV shipment data one of the most honest real-time readings of consumer financial health available. It also has a direct freight translation: RVs are built from steel, aluminum, appliances, furniture, and wiring harnesses that move by truck both inbound to the factory and outbound to dealer lots, meaning when RV production softens, load boards in northern Indiana feel it before most other indicators have moved.
Get the clearest, most accurate view of the truckload marketplace with data from DAT iQ.
Tune into DAT iQ Live, live on YouTube or LinkedIn, 10am ET every Tuesday.
The latest RVIA data tells a tale of two consumers. Motorhome shipments surged 22% year-over-year in February 2026, driven by older, asset-rich buyers whose net worth remains intact and whose decisions are only marginally affected by still-elevated financing costs. Towable shipments — travel trailers and fifth wheels that skew toward middle-income, financed buyers — are down 14% year-to-date. That divergence is the K-shaped economy in wholesale shipment data: higher-income households spending while middle-income households pull back under the weight of elevated loan rates, credit stress, and tariff-driven cost increases on steel and aluminum components.
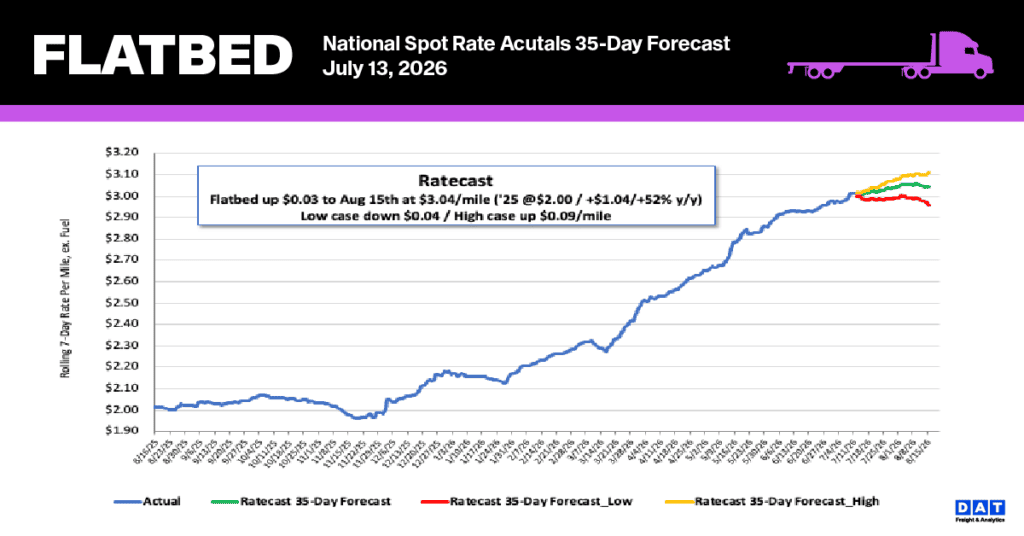
For flatbed carriers, the takeaway is straightforward. Around 80% of U.S. RVs are built in Elkhart County, Indiana, and towables are the volume driver — motorhomes move via driveaway, not truckload. Towable softness hits outbound flatbed lanes from the Midwest to the Southeast and West, and slows inbound dry van component freight before finished unit production stops. DAT flatbed rates are running ahead of year-ago levels and capacity is tightening, but a durable freight market recovery also requires towable demand to rebound — and that depends on financing costs coming down further. Watch monthly RVIA towable shipment data closely. It will tell you when the freight cycle is genuinely turning.
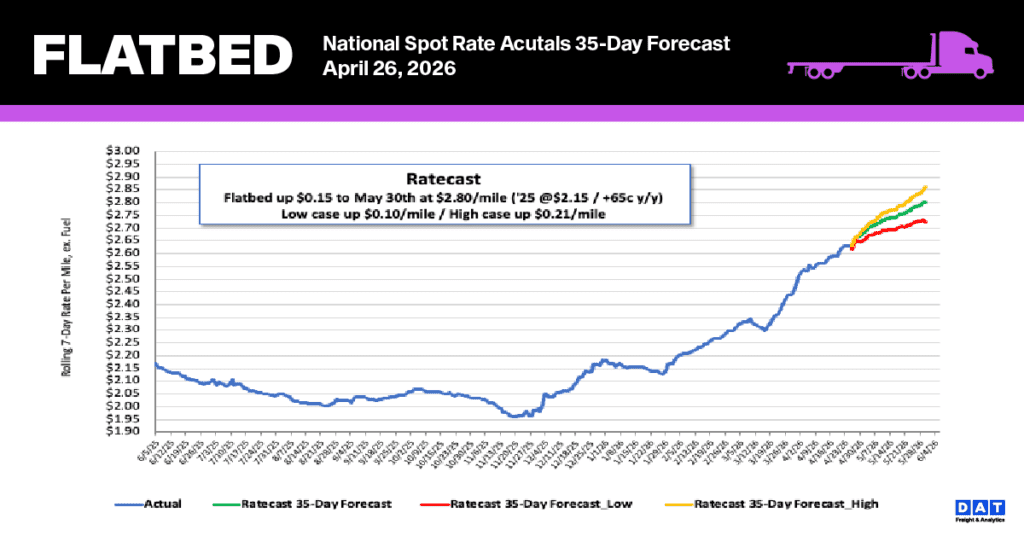
National flatbed linehaul spot rates
Flatbed spot rates have seen a significant, sustained rise, culminating in a new high of $2.66 per mile in Week 17, an increase of $0.05 from the previous week. This six-week growth streak has added a total of $0.35 to the national average, bringing it within $0.04 of the all-time record set in late June 2022. The current rate is notably elevated compared to historical figures. It is $0.54 (24%) higher than the rate during the same period last year and surpasses the five-year average (excluding pandemic years) by $0.68 (26%).
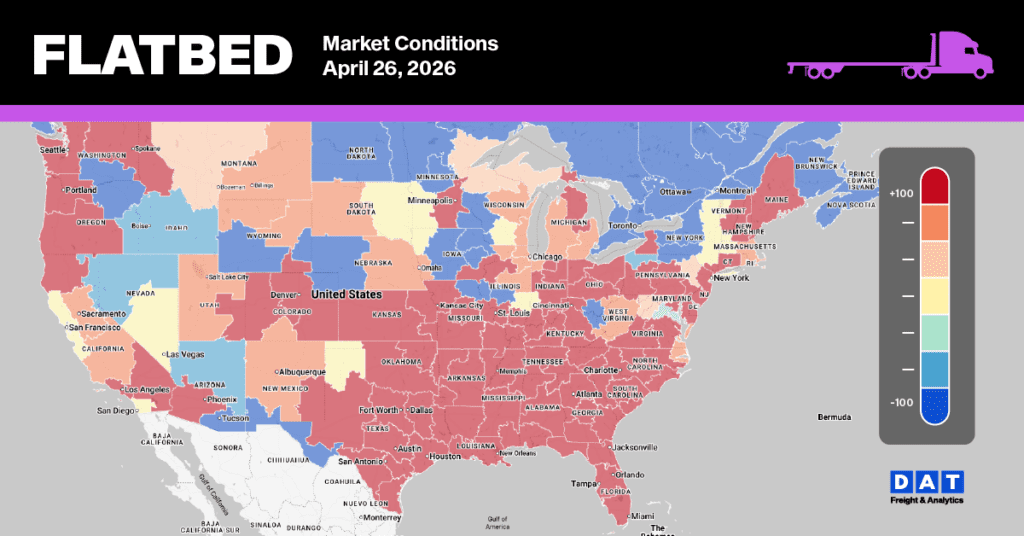
Flatbed Market Conditions
The flatbed segment remains exceptionally tight. Although flatbed load posts were mostly flat last week, they are still remarkably high—68% above last year’s figures and 55% higher than the five-year average (excluding the atypical years of 2021 and 2022). This strong market environment was further evidenced by a 2% drop in available flatbed equipment posts. Consequently, the flatbed load-to-truck ratio saw a slight increase of just over 1%, reaching 74.12.