Data analysis for the week ending Saturday, April 18th, 2026 Week 16. All rates cited below exclude fuel surcharges, and load volume refers to loads moved unless otherwise noted. The rate charts exclude 2021 and 2022 years influenced by the pandemic.
The Association of Equipment Manufacturers’ March 2026 Farm Flash report delivered a gut punch for open-deck carriers heading into planting season. Self-propelled combine harvester sales fell 25.3% month-over-month and sit 3.5% below year-to-date 2025 levels. Large 4WD tractors — the 100+ horsepower machines that generate some of the most valuable open-deck loads in the country — dropped 24.4% in March and are down 25.3% year-to-date. This isn’t a blip. It’s a demand cliff, and it’s happening at exactly the time of year when ag equipment freight should be building.
Get the clearest, most accurate view of the truckload marketplace with data from DAT iQ.
Tune into DAT iQ Live, live on YouTube or LinkedIn, 10am ET every Tuesday.
The numbers tell the story: Open-deck specialized carriers are seeing a significant decline in agricultural equipment hauling. In March, they moved 61 fewer combine harvester loads compared to the previous year. This downward trend is consistent across the first quarter of the year, with an 18-load drop compared to Q1 2025. The numbers for big tractors are even more striking: a reduction of 1,515 loads in March versus last year, contributing to a massive 3,236 fewer loads hauled in the first three months of this year compared to the same period in 2025.
The reasons aren’t hard to find. Corn and soybean prices are trading near or below breakeven for many operations once you stack fertilizer, fuel, crop insurance, and financing on top. The export safety net that once propped up commodity prices has frayed badly, with China pulling back from U.S. agricultural purchases amid ongoing trade tensions. When the export lane disappears and input costs stay elevated, capital equipment purchases are the first thing that gets deferred. Farmers aren’t buying as many new combines and big tractors this planting season.
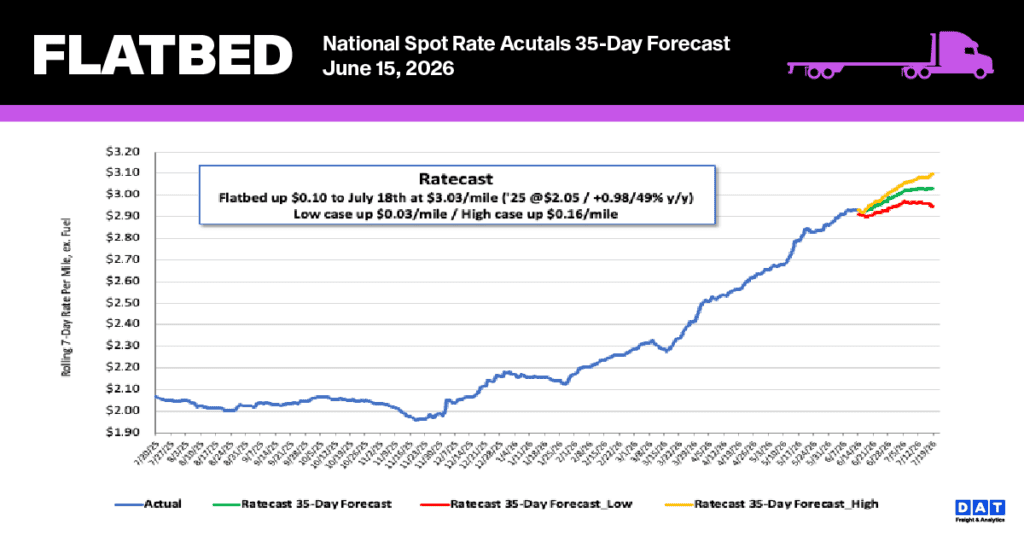
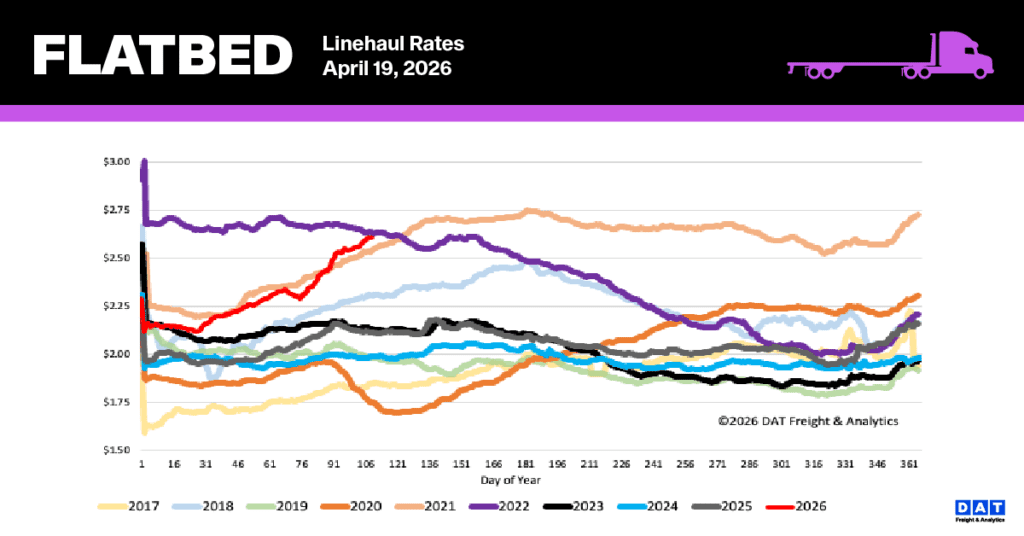
National flatbed linehaul spot rates
Flatbed spot rates maintained their upward momentum, increasing by another $0.03 last week to reach a national average of $2.61 per mile. This rate is just $0.03 shy of the record set in Week 16 of 2021. This recent rise caps a five-week period of strong growth, during which the rate climbed a total of $0.30 per mile. The current rate is significantly elevated compared to historical averages: it is $0.49 higher than the rate from the same period last year (a 23% increase) and exceeds the five-year average (excluding pandemic years) by $0.62 (24%).
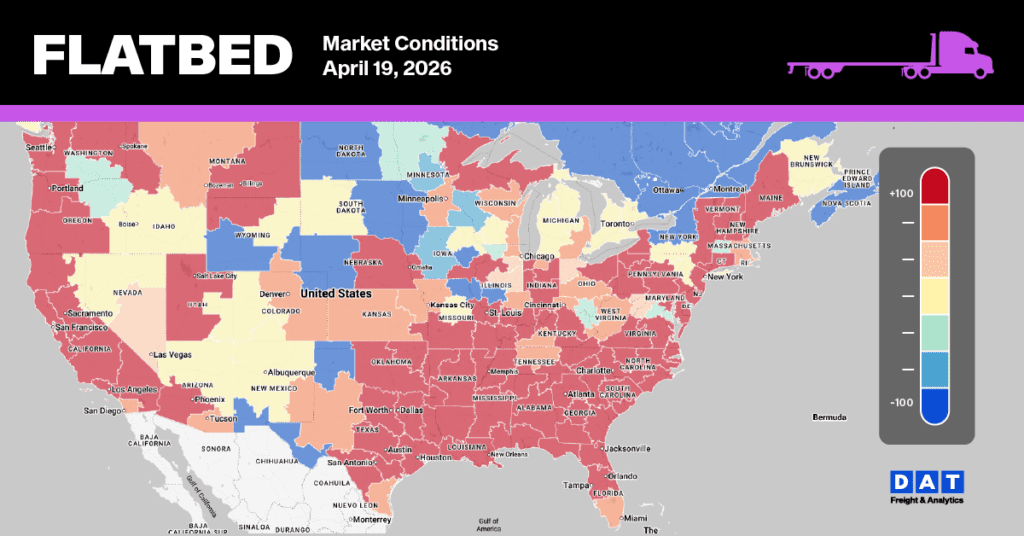
Flatbed Market Conditions
Despite a 7% drop last week, flatbed load posts remain exceptionally high. They are 76% above last year’s figures and 58% higher than the 5-year average (excluding the unusual years of 2021 and 2022). This tight market environment was reinforced by a slight decline in flatbed equipment posts. As a result, the flatbed load-to-truck ratio fell by 7% to 75.22.