The Big Picture
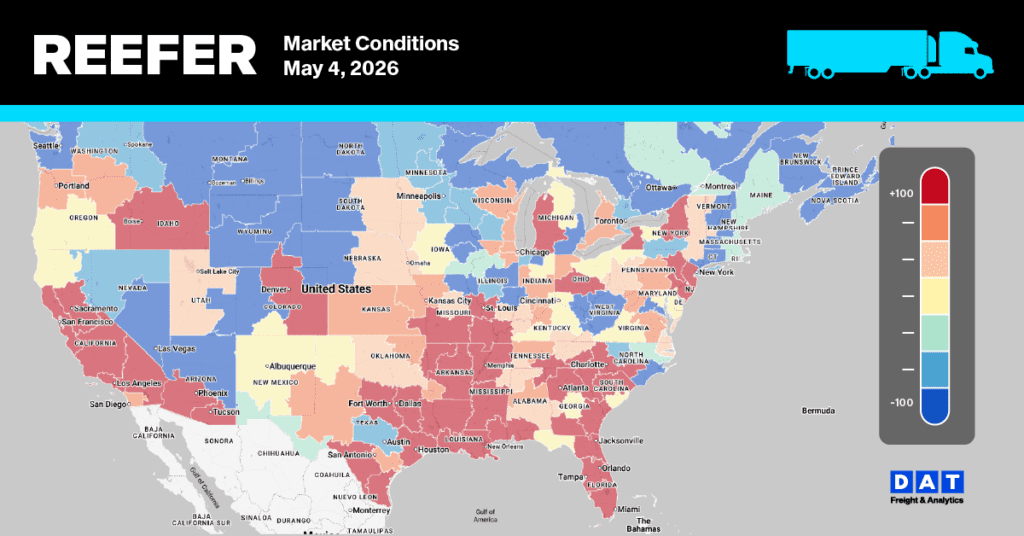
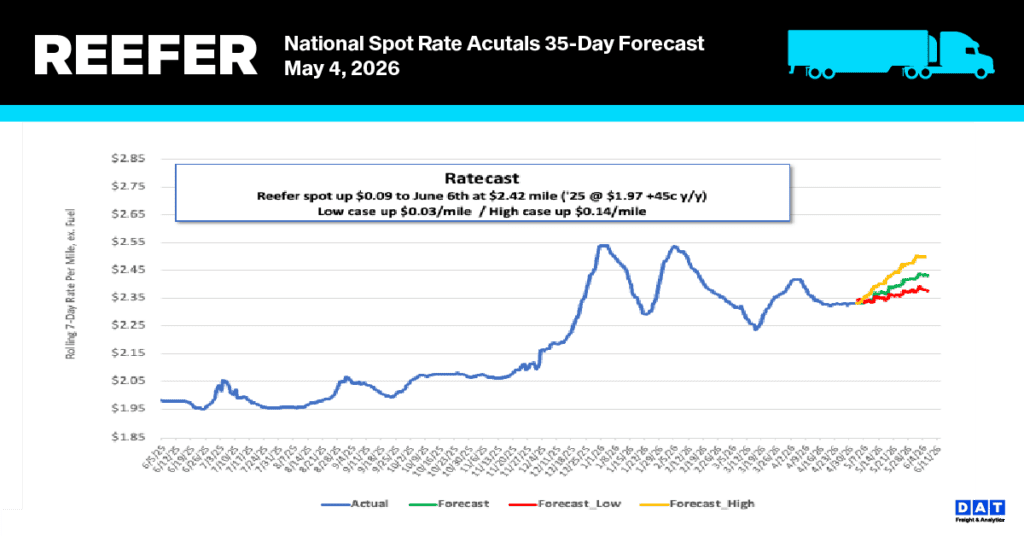
Florida is Shortage — and it’s not just about produce. With Mother’s Day days away, 90% of imported floral shipments from Ecuador and Colombia flow through Miami, and that flood of reefer freight is colliding with a produce season already running on fumes. DAT reefer spot rates out of Florida are up +25% week-over-week and year-over-year. Outbound Florida produce volumes are running 40% below year-to-date averages — a hole dug by Winter Storm Fern earlier this season — but watermelon shipments are just getting started, keeping some load activity alive. Add RoadCheck Week pulling drivers off the road and this market is as capacity-constrained as it gets. The ceiling is real, though: as produce transitions to the Southeast and West Coast over the next two to three weeks, a sharp rate correction is coming. This week and next are the last calls for peak Florida rates. Meanwhile, Vidalia onions are running hot across every lane for a second straight week, South Texas posted a jarring +31% on the Boston corridor, and California coasts remain mostly flat. Colorado potatoes shipped their last load of the season.
Get the clearest, most accurate view of the truckload marketplace with data from DAT iQ.
Tune into DAT iQ Live, live on YouTube or LinkedIn, 10am ET every Tuesday.
Central & South Florida — Capacity Shortage
USDA did not publish rate data for Florida this week but what DAT data shows is stark: reefer spot rates out of Miami are up +25% week-over-week and year-over-year. The convergence of forces driving this is unusual even by Florida season standards.
Three things are hitting simultaneously. First, Mother’s Day floral imports — roughly 90% of cut flowers from Ecuador and Colombia clear through Miami — are consuming reefer capacity that would otherwise move produce. Second, RoadCheck Week is pulling compliant capacity off the road as carriers avoid inspection exposure. Third, watermelon season is just getting started, adding outbound load volume at exactly the wrong time from a capacity standpoint. Set against all of this: outbound Florida produce volumes are running 40% below year-to-date pace due to crop losses from Winter Storm Fern earlier this season — so the volume base is already depleted even as trucks get scarcer.
This is a squeeze play with a known expiration date. As the produce calendar shifts to the Southeast interior and West Coast over the next two to three weeks, and as the floral surge clears post-Mother’s Day, expect a sharp rate correction. Carriers in Florida right now are operating at the top of the cycle. Shippers and brokers should plan accordingly — the correction, when it comes, will be fast.
Vidalia District, Georgia — Adequate Capacity
The Vidalia pack is running hot – Georgia onion volume up 27% w/w. Every lane posted a double-digit gain this week, with Los Angeles leading at +18% and Atlanta up +15%. This is the second consecutive week of broad-based rate increases out of Vidalia — the seasonal demand surge that comes with the Georgia onion pack is fully underway. Vidalia volume ships nationwide, which means rate pressure is spreading across a wide destination footprint.
Mexico Crossings Through South Texas — Adequate Capacity
South Texas was the week’s biggest mover – Mexican import volumes up 14% w/w led by Avocado volumes, up 45% w/w. Boston rates exploded +31%, a spike that stands out sharply against a largely flat week everywhere else in the region. The Boston anomaly may reflect tight reefer availability on long Northeast corridors as Florida’s load pool shrinks. Other lanes were mostly flat to modest gains, with Los Angeles the only notable decline at -7% w/w but still 72% higher y/y. South Texas remains Adequate — positioned to absorb demand as Florida’s season winds down.
Mexico Crossings Through Nogales — Adequate Capacity
Nogales softened modestly across most East Coast lanes this week – DAT reefer spot rates flat w/w but still 30% higher y/y. Chicago was the lone bright spot at +5%. Dallas and Los Angeles, both Slight Surplus, continued their downward drift. No supply disruptions reported; the market here is orderly.
Salinas-Watsonville, California — Adequate Capacity
Salinas mixed this week — Chicago picked up +3% while East Coast lanes softened. Baltimore -4%, New York -5%, Philadelphia -4%. The Salinas-to-East Coast softening may reflect seasonal normalization as the spring push matures. Strawberry volumes out of Salinas remain part of the mix – truckload volumes up 19% w/w and 12% y/y.
Yakima Valley & Wenatchee District, Washington — Adequate Capacity
Yakima was mostly flat to slightly soft this week – DAT spot rates down 5% w/w but still up 6% y/y. USDA volumes down 8% w/w. Philadelphia rates dropped -7%, Boston -3%, Miami -4%. Seattle was the lone bright spot at +11%, but that’s a short haul with low absolute dollar values ($1,200–$1,350 most). Long-haul East Coast rates are easing modestly.
San Luis Valley, Colorado — LAST REPORT ⚠️
Colorado potatoes issued their final report of the season this week. All lanes flat on exit.
Source: DAT Rateview | USDA AMS Specialty Crops National Truck Rate Report, April 29, 2026. Rates represent open (spot) market per-load prices including broker fees for 48–53 ft. refrigerated trailers. Percentage changes vs. May 6, 2026.
National reefer linehaul spot rates
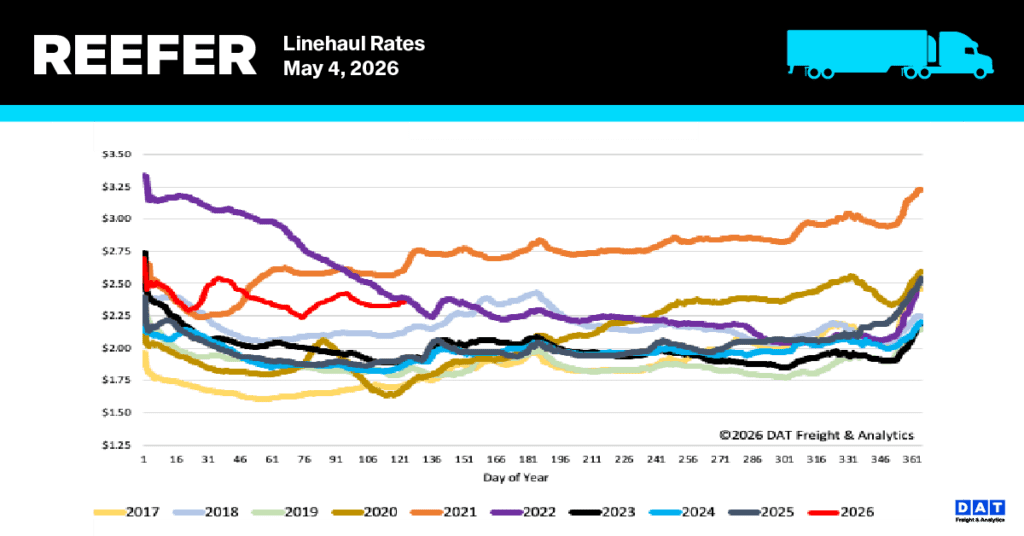
Last week, reefer linehaul rates edged up by $0.01 to an average of $2.36 per mile. Excluding fuel surcharges, current spot rates for refrigerated transport across all temperature zones and commodities continue to hold at historically elevated levels. Present rates are $0.44 (22%) above last year’s figures and $0.51 (22%) higher than the five-year average, when pandemic-related peaks from 2021 and 2022 are omitted.
In major produce-growing regions, truckload rates for fruit and vegetable shipments are averaging $3.84 per mile, marking a 10% increase over the $3.49 per mile recorded at the end of April last year. The USDA reports that although volumes are around 15% lower year to date, truck availability has shifted into a slight shortage, contrasting with the adequate equipment supply observed at the beginning of the previous produce season.
Reefer Market Conditions
Driven by a 2% rise in USDA produce volumes, reefer load posts climbed 6% last week as capacity tightens in anticipation of Mother’s Day and next week’s Roadcheck event. Conversely, equipment posts fell 7%, leaving availability 24% below previous-year levels and 49% under the Week 18 long-term average as carriers face mounting regulatory and enforcement pressure. These shifting dynamics pushed the load-to-truck ratio up by 18% to 15.02.