Home Depot is aggressively pivoting from DIY shoppers to professional contractors — acquiring wholesale distributors of roofing shingles, drywall, and ductwork to capture a larger slice of the $700 billion pro market. With housing turnover near historic lows and new construction flat, the company is chasing share, not market growth. For flatbed carriers, that means building materials freight is increasingly flowing through B2B wholesale distribution networks rather than retail replenishment lanes — shifting load origins and concentrating volume in suburban and exurban corridors that don’t always overlap with where Home Depot’s 2,350 stores sit.
Get the clearest, most accurate view of the truckload marketplace with data from DAT iQ.
Tune into DAT iQ Live, live on YouTube or LinkedIn, 10am ET every Tuesday.
The freight profile changes significantly when a retailer starts moving truckloads of shingles instead of bags of grout. Heavy, oversized, and palletized construction materials are open-deck freight, and as Home Depot’s wholesale acquisitions scale up, lane density and load availability in construction corridors should follow — assuming housing activity cooperates. DAT flatbed data shows spot demand in those lanes remains closely tied to housing starts and permit activity, both of which are still suppressed by elevated remodeling costs (up ~45% since 2019) and tight mortgage markets.
For brokers, the strategic play is to get ahead of where these wholesale distribution networks are being built out geographically. New freight origin points, thinner carrier coverage, and pricing opportunity tend to arrive together — and carriers and brokers who map those nodes early will be best positioned when the volume ramps.
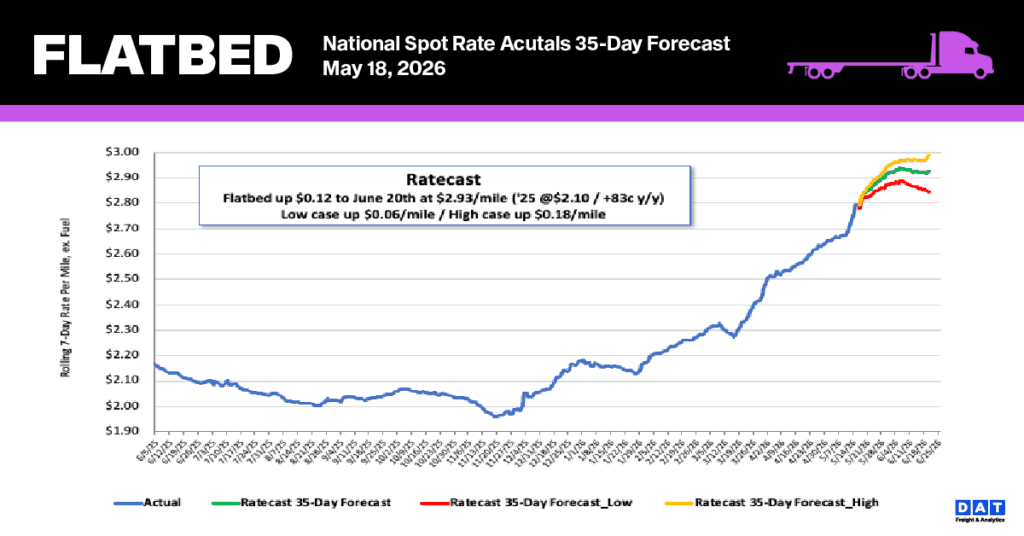
National flatbed spot rate trends
With load securement serving as an area of focus for Roadcheck this year, many flatbed carriers opted for time off, triggering a swift contraction in capacity. Consequently, flatbed rates climbed $0.10 per mile last week to reach an average of $2.79. This increase caps a nine-week growth period where the segment surged by $0.48 per mile (20%), establishing the highest Week 20 rates on record and eclipsing the previous peak from June 2021 by $0.04 per mile. Current rates remain substantially elevated relative to historical norms, sitting $0.62 (28%) above last year’s levels and $0.80 (29%) higher than the non-pandemic five-year average.
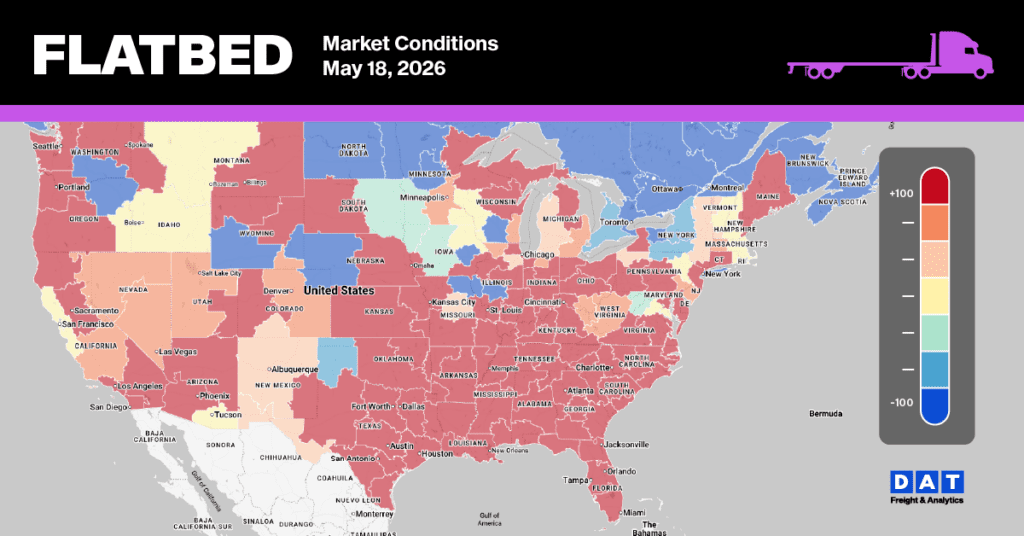
Flatbed Market Conditions
While flatbed load post volumes grew by slightly more than 13% this past week, they continue to be strong relative to historical trends, tracking 58% ahead of last year and 56% above the five-year average (omitting 2021 and 2022). Flatbed operators paused their activity at twice the rate of their reefer and dry van counterparts, leading to a 20% decline in equipment posts compared to the 9-year average drop of only 9%. Driven by these evolving supply and demand factors, the flatbed load-to-truck ratio surged 41%, settling at 82.82.