The Big Picture
The Mother’s Day hangover is real. Florida spot rates are pulling back sharply — Atlanta dropped -24% in a single week — exactly the correction telegraphed when DAT reefer rates surged +25% on the floral push two weeks ago. But the story isn’t just what Florida lost; it’s what California gained. Salinas-Watsonville, South/Central CA, and Santa Maria all posted double-digit rate increases on key East Coast lanes, with Santa Maria → New York at +66% being the most eye-popping number in this report. West Coast produce is stepping into the vacuum as Florida transitions out. South Texas remains at Shortage but is softening, down across nearly every lane. Yakima and Vidalia are quiet. This is the seasonal handoff — and if you’re not repositioning capacity accordingly, you’re late.
Get the clearest, most accurate view of the truckload marketplace with data from DAT iQ.
Tune into DAT iQ Live, live on YouTube or LinkedIn, 10am ET every Tuesday.
Central & South Florida — The correction arrives
The post-Mother’s Day rate collapse is not a surprise, but the magnitude on the Atlanta lane is striking. Florida entered Shortage two weeks ago on Mother’s Day floral demand, RoadCheck-reduced truck supply, and early watermelon season. That window has closed. USDA volumes down 34% YTD.
The Atlanta lane — historically one of the most volatile Florida destinations — has now given back roughly half of its Mother’s Day gains in a single week. Northeast lanes (Baltimore, Boston) are holding near flat, likely supported by ongoing watermelon and summer vegetable volume. Watch these lanes over the next two weeks: if Florida’s load pool continues to shrink as the season winds south toward the Carolinas and Georgia, rates on Northeast lanes could follow Atlanta lower.
California — The West Coast powers up
This is the week California takes over the narrative. Multiple districts posted their largest week-over-week rate increases of the current season, and Slight Shortage conditions are uniform across every California origin in this report. The Salinas-Watsonville season is building volume, and the combined effect of spring demand and tightening truck supply is showing up in the data.
The New York and Philadelphia top-end rates ($17,900 and $17,000 respectively) are the highest in this report. Wide rate ranges like these typically signal active negotiation between carriers and brokers — not a settled market.
Santa Maria
Santa Maria → New York at +66% is the single largest percentage move in this report. This lane bears watching — a +66% weekly jump often reflects either a sudden truck availability shift or an outlier load that skewed the range. If it repeats next week, it’s structural.
South & Central California
The split between vegetable (Slight Shortage) and citrus (Adequate) availability out of S/C CA is notable — trucks are tightening around produce volume but citrus is not yet driving competition for equipment.
Oxnard District
Kern → Chicago +39% on carrots alone is significant. Kern’s carrot volume is relatively thin, so this spike may reflect carrier selectivity on a corridor that doesn’t pay as well as the longer Northeast hauls without a strong load pool to support it.
Mexico crossings through South Texas — Shortage holding, Rates softening
South Texas remains at Shortage for all reported lanes, but the rate direction has reversed from the recent tightening streak. Nearly every lane is down week-over-week, with Boston posting the sharpest correction at -22%.
The prior two reports showed South Texas absorbing overflow demand from a tightening Florida market. With Florida now correcting and the West Coast stepping up, some of that displaced demand pressure is dissipating. South Texas → Boston at -22% is the canary — that lane had been the bellwether for Northeast reefer tightness. Watch whether it stabilizes or continues to erode next week.
Mexico crossings through Nogales, AZ — Holding firm
Nogales continues to post Slight Shortage conditions across all reporting lanes. Rates are largely unchanged week-over-week (no percentage changes published for most lanes, indicating stability or data continuity).
Imperial/Coachella Valleys & Calexico/San Luis crossings — Broad gains
Only Atlanta declined out of this district this week. The breadth of the increases — particularly Baltimore, Dallas, New York, and Seattle all at +18–20% — suggests this is a supply-side truck availability story, not demand-specific.
Vidalia District, Georgia — Flat, season in full swing
The Vidalia pack is running at full cadence. All lanes flat week-over-week.
Yakima Valley & Wenatchee, Washington — Quiet with mixed signals
Yakima is posting modest moves in both directions. The local Seattle lane dropped -12%, consistent with intra-Pacific Northwest softness. Midcontinent and Midwest lanes edged higher.
What This Means for Carriers, Shippers & Brokers
Carriers: The Florida window is closing — Atlanta dropped -24% in one week and that is not a one-day anomaly. If you’re running reefer out of Florida, start planning your transition to Southeast produce origins (Georgia, Carolinas) or reposition toward California where the money is moving right now. Salinas → New York at up to $17,900 and Santa Maria → New York up +66% are the best-paying corridors in this report. The caveat: California is competitive and those wide rate ranges signal active negotiation. Know your floor before you bid. South Texas remains above-average paying despite softening — the Shortage designation holds, and loads are there for the taking on most Northeast corridors above $10K.
Shippers: If you’re sourcing from Florida, your freight costs are coming down — but not uniformly. Atlanta rates fell sharply, while Baltimore and Boston held near flat. Lock in Northeast rates now before California supply tightens further and competitive truck demand on long-haul East lanes spills back into Florida coverage. For shippers sourcing from California, this week’s rate spikes — especially Salinas and South & Central CA to New York and Philadelphia — are real. Budget accordingly for the next 4–6 weeks as spring lettuce and berry volume peaks. Vidalia remains Adequate and flat; if you’re moving onions, now is the time to cover lanes before summer heat compresses the pack window.
Brokers: Three things to act on this week. First, the Santa Maria → New York +66% move needs to be verified — if your carrier network is confirming that range, great; if it’s a data outlier, don’t let it anchor your rate conversations. Second, South Texas → Boston -22% is a significant reversal on a lane that had been running tight for three consecutive weeks. If you’ve been covering that corridor aggressively, reassess your carrier commitments — softening rates mean your covered loads may be priced above where the market is clearing. Mexico import volumes were down 4% w/w and 3% YTD. Third, Kern → Chicago +39% on carrots is an opportunity: if you have consistent volume on that lane, locking in a short-term carrier relationship now — before rate expectations fully reset upward — is worth the conversation.
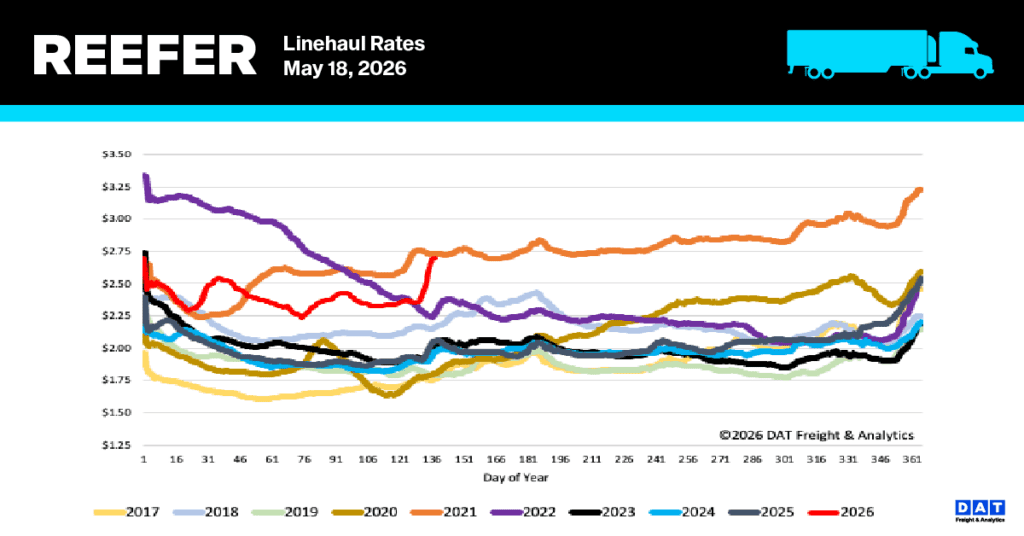
National Reefer Spot Rate Trends
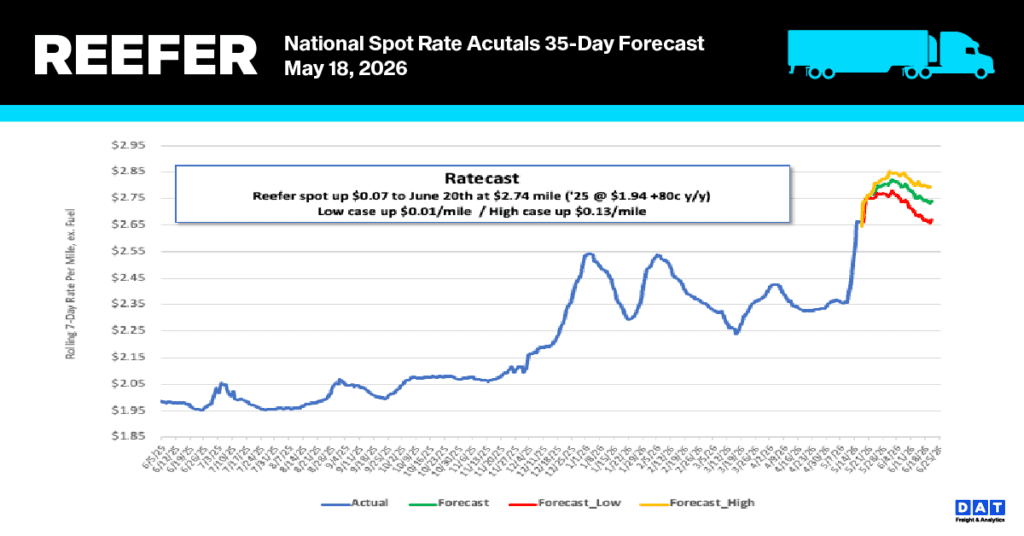
Following a month of notable consistency, reefer linehaul rates experienced a record-breaking weekly surge of $0.32 per mile, driven by the intersection of Roadcheck Week capacity constraints and the onset of the produce season. By last week, the national 7-day average, excluding fuel, reached $2.68 per mile. These refrigerated transport spot rates continue at historical highs across all products and temperature ranges, even without fuel surcharges. Current data indicates a substantial rise over historical benchmarks, sitting 32% ($0.54) higher than the previous year and 30% ($0.66) above the five-year average when pandemic-related peaks from 2021-2022 are omitted.
Current reefer spot rates for fruit and vegetable transport in major produce hubs are averaging $3.91 per mile. This represents a significant week-over-week jump of approximately $0.36 per mile and sits $0.45 higher than rates recorded during the same period last year. While USDA data indicates a minor dip in produce volumes over the last week, overall levels remain up by 3.3% compared to the previous year. Consequently, sector capacity has shifted from adequate (3) toward a slight shortage (4) as supply tightens.
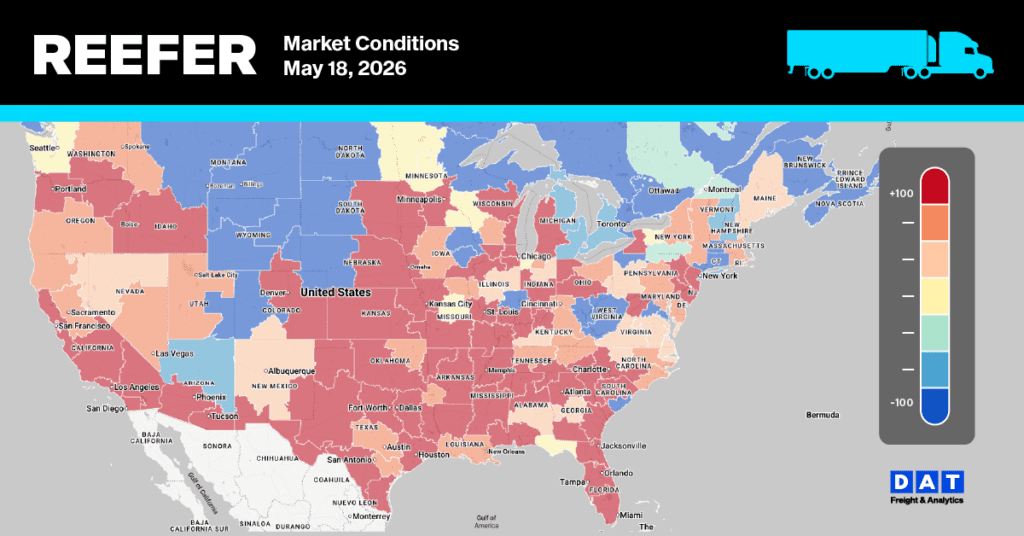
Reefer Market Conditions
The recent 72-hour Roadcheck safety blitz intensified regulatory and enforcement pressure on carriers, leading to a 12% decline in reefer equipment posts—the lowest volume recorded this year. Consequently, equipment availability has fallen 21% below last year’s levels and is currently 52% lower than the Week 20 historical average. These supply constraints triggered a 70% surge in the load-to-truck ratio, which now stands at 27.6.