Despite all the media attention on port congestion on the West Coast, total TEU (twenty-foot equivalent unit) container import volumes increased by 2% month-over-month in November to a total of 2.53m TEU. Compared to the same time last year, TEU volume is up 5%.
Find loads and trucks on the largest load board network in North America.
Note: All rates exclude fuel unless otherwise noted.
The Port of Los Angeles recorded a 5% decrease in TEU last month while nearby Port of Long Beach operations saw volumes increase 10%. Both ports combined accounted for 34% of total import volumes in November. The Port of New York and New Jersey was the third largest port for November imports (16% share) where volumes were also up by 5% m/m and 5% y/y.
Even though port congestion is easing in Savannah, November TEU volumes (7% share) were down 5% compared to October because of the backlog of vessels waiting to unload.
Houston rounded out the top 5 ports in November with 6% share. Houston also benefited from 19% m/m increase as ocean carriers and shippers looked to less congested ports for imports. A similar story unfolded in nearby Mobile (1% share) where monthly volumes were up 38%.
Looking at imports year-to-date by coast, the effects of West Coast port congestion and record-high shipping costs are very evident. Since the start of the year, TEU volumes were down 6% on the West Coast, up 5% on the East Coast and up 23% along the Gulf Coast. Imports from China are down 4% on the West Coast and up 17% on the East Coast.
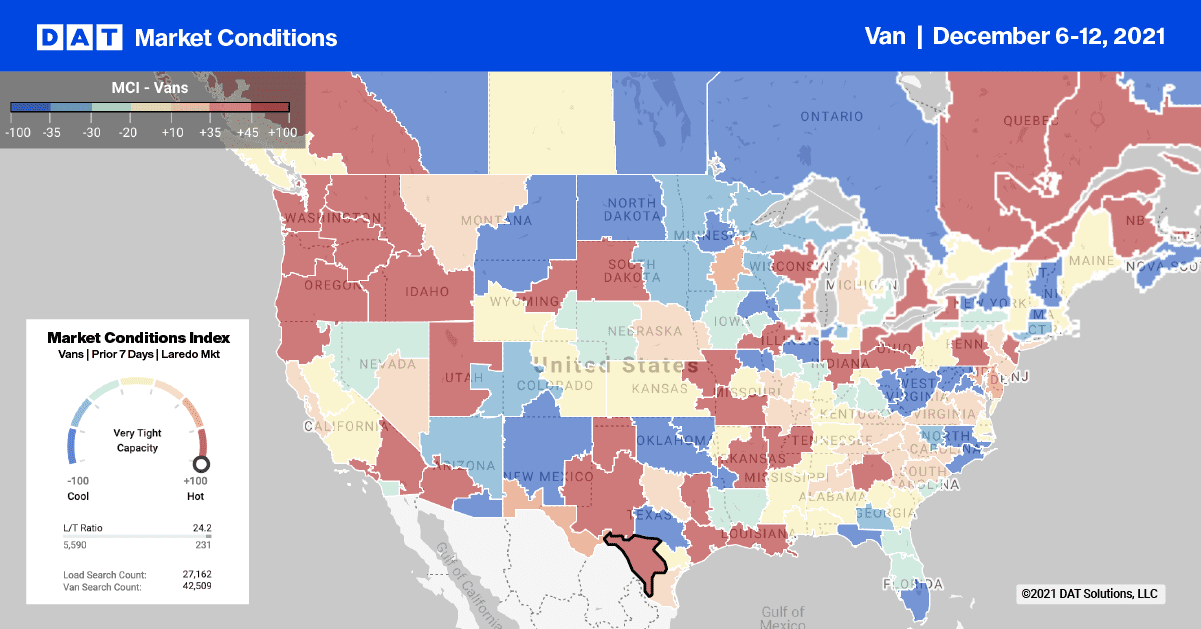
Houston stood out last week
It’s not unusual to see spot rates cool slightly right before the end-of-year holiday break. But this year is different, given how tight capacity has been all year. Volumes in the top 10 markets dropped 15% last week. Houston was the only top 10 dry van market to post gains (up 5%).
Capacity was tight in Houston for outbound loads last week as spot rates climbed $0.04/mile to an average of $2.27/mile. Loads moved from Houston were up on major lanes, including:
- Los Angeles (up 15%)
- Atlanta (up 13%)
- Chicago (6% w/w)
Spot rates for loads to Chicago were paying $2.27/mile last week — $0.09/mile higher than the November average — while loads east to Atlanta were up $0.16/mile to an average of $2.81/mile.
Spot rates
Spot rates in the dry van sector last week remained relatively flat last week with the national average spot rate staying at $2.60/mile. Dry van spot rates are still 14% or $0.38/mile higher than this time last year.
The average spot rate for the top 10 markets decreased by just $0.01/mile to $2.93/mile last week, making it the third consecutive week of dropping spot rates. It’s down $0.04/mile since Thanksgiving.
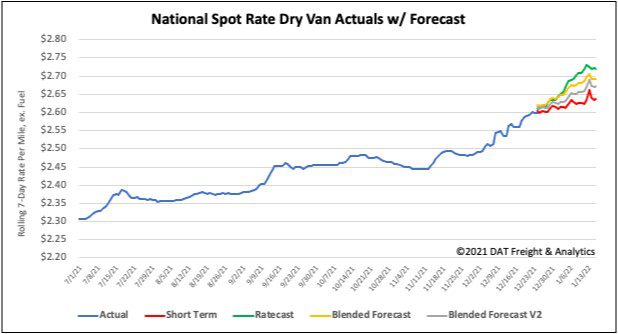
How to interpret the rate forecast:
- Ratecast: DAT’s core forecasting model
- Short Term Scenario: Formerly the pessimistic model that focuses on a more near-term historical dataset
- Blended Scenario: More heavily weighted towards the longer-term models
- Blended Scenario v2: More heavily weighted towards the shorter-term models


