The word “disruption” seems too mild to describe the impact of COVID-19 on truck freight. Supply chains are strained to the breaking point, and consumer habits have undergone a seismic shift. It would be tough to overstate the amount of change and the speed of transformation in freight flows. It could be a while before life returns to normal, and it may be a “new normal” at that.
I’ve seen at least one positive outcome for our industry, though. Truck drivers are finally getting some well-deserved recognition for being the tireless heroes of our day-to-day lives. They’ve gotten shoutouts from USA Today, The Wall Street Journal, and in the President’s daily press briefings.

Unfortunately, drivers’ working conditions aren’t improved by the coronvavirus-fueled unpredictability and volatility in schedules and wait times at many pickup and delivery locations. And when it’s time for a much-needed break, it’s harder than ever for drivers to find parking, food, and other accommodations along their routes.
With all the upheaval, it’s no surprise that rates are rising sharply, all over the country. We track 100 high-traffic van lanes every week, and last week the rates rose on 88 out of 100, with only 4 lanes declining compared to the previous week. Those price drops were small as well as few in number, and in every case, the rates rose on the return trip.
The biggest changes were on those “tweener” lanes with lengths of haul in the 250- to 600-mile range, where a driver typically can’t complete either a one-way or a roundtrip in a single day.
- Memphis to Chicago shot up 25¢ to $2.06 per mile, and Chicago to Memphis added 10¢ to $1.93.
- Atlanta to Columbus gained 19¢ to $1.78, and Columbus to Atlanta rose 8¢ to $2.06 (At least 4 other lanes out of Atlanta also posted big gains.)
- Stockton, CA, to Salt Lake City posted a 22¢ increase to $2.30, and Salt Lake City to Stockton rates rose 5¢ to $1.56. Look out for deadhead.
- Dallas to Los Angeles is up 13¢ to $1.52, which is not a great rate, and L.A. to Dallas at $1.48 is not any better. But the rates are trending up.
- Columbus to Memphis added 14¢ to $1.75 and Memphis to Columbus gained 8¢ to $2.16.
- Dallas to Houston hit $2.42 per mile last week, up 19¢, and Houston to Dallas rose 3¢ to $2.03.
That list of rising lane rates could go on for a while. Bottom line: Whether you’re a broker or a carrier, you’ll want to check out the rates at both ends of each run, so you understand what the rest of your week will look like. Then take a few extra minutes to research the conditions at every pickup and dropoff location. Be sure you have accounted for detention and layovers in every rate confirmation. This is not a good time for trucks to be sitting idle.

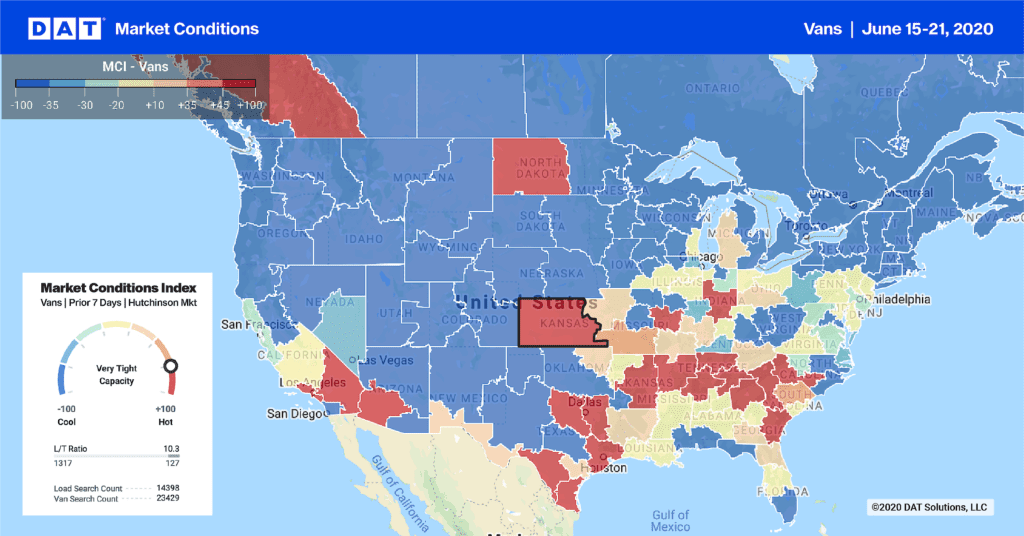
Hot Market Maps show a higher concentration of demand, and a relative shortage of trucks, in freight markets throughout the South Central and Southeast regions, but rates rose everywhere. This map-based display of load-to-truck ratios is available in DAT Power and DAT RateView.
Here’s the complete list of high-volume lanes where rates declined last week. Note that in each case, rates rose in the opposite direction to more than offset the declines:
- Seattle to Medford, OR dropped 13¢ to $2.31 per mile, but the return trip is up 21¢ to $2.76, so the roundtrip is not a net loss.
- Denver to Oklahoma City lost 3¢ to $1.16, a.k.a., from bad to worse. OKC to Denver rocketed up to $3.05 per mile, however, which is way higher than it’s been all year.
- Seattle to Stockton, CA, lost a penny to $1.35 and Stockton to Seattle gained 13¢ to $2.37
- Houston to Laredo also edged down 1¢ to $1.37, and Laredo to Houston zoomed up more than 30¢ to $2.41, the highest average rate since 2018.
The rates listed above are rolling, 7-day averages from DAT RateView for the week ending March 22. Rates change rapidly, especially nowadays, so be sure to check for daily updates in RateView on more than 65,000 point-to-point lanes.


