The February 2023 reading of the for-hire trucking ton-mile seasonally adjusted index produced by Yemisi Bolumole and Jason Miller at Michigan State University (MSU) saw demand flat compared to January 2023 and down 1% y/y. The ton-mileage index is derived from the physical quantity output for 41 freight-producing industry sectors. According to Professor Miller, “Demand for trucking is still above pre-COVID levels, with seasonally adjusted February 2023 ton-miles coming in 1.0% above the seasonally adjusted high for 2017 – 2019, which occurred in May 2018. Trucking ton-miles in February were flat seasonally adjusted and will likely remain negative year-over-year for the foreseeable future.”
Another transportation demand indicator is the Freight Transportation Services Index (TSI), which is based on the freight carried by the for-hire transportation industry. The latest report indicated an increase of 1.4% in February from January, according to the U.S. Department of Transportation’s Bureau of Transportation Statistics (BTS). Compared to From February 2022, the TSI decreased by 0.8%. The February Freight TSI is 11.9% above the pandemic low in April 2020 and has increased in 21 of the 34 months since that low.
According to the Bureau of Transportation Statistics, “the freight component of the TSI, which encompasses five modes of transportation, shows a strong leading relationship to the economy. When the freight TSI’s accelerations and decelerations (the detrended series’s turning points) are compared to the growth cycles of the economy, the freight measure leads by an average of approximately four months.”
Market Watch
All rates cited below exclude fuel surcharges unless otherwise noted.
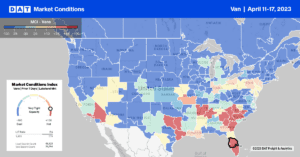
In the largest distribution market in the Southeast, volumes increased by 9% w/w in Atlanta, pushing Houston out of the number-one spot. The was sufficient spot market capacity to meet last week’s demand resulting in outbound rates dropping by $0.04/mile to $1.60/mile. Georgia’s outbound spot rates are identical to the 2017 and 2019 levels at the state level. Regional loads from Atlanta to Orlando averaged $2.51/mile last week, the lowest in 12 months and $1.00/mile lower than the previous year.
On the West Coast in California, dry van capacity continues to tighten for the third week following another penny-per-mile gain. At $1.83/mile for outbound loads, state-level rates were identical to 2020. In Los Angeles, rates increased for the fourth week averaging $1.56/mile, while further north in Stockton, rates increased by $0.03/mile to $1.52/mile. The volume of loads moving between these two markets increased by almost 2% last week, with little change in spot rates since February at $2.50/mile.
In the Midwest markets of Chicago and Joliet, IL, rates continue to slide following last week’s $0.07/mile decrease to $1.95/mile on 8% lower w/w volumes. In Texas, dry van rates have steadily fallen for the last month averaging $1.62/mile the previous week. In Houston, volumes were down by 2% w/w, with linehaul rates dropping by $0.05/mile to $1.68/mile.
Load-to-Truck Ratio (LTR)
Volumes increased by 10% last week and are now higher by the same amount as the Week 15 average in pre-pandemic years. Load posts are still around half what they were a year ago. Still, recent trends confirm that shippers are strategically shifting more loads to the spot market compared to prior years, excluding 2021 and last year. Equipment posts are around 8% higher than the Week 15 average over the same timeframe resulting in last week’s dry van load-to-truck ratio (LTR) increasing from 1.60 to 1.82.
Linehaul Spot Rates
Excluding the fuel surcharge, dry van linehaul rates are $0.09/mile above 2019 levels, but that gap is steadily closing following last weeks are getting closer to 2019 levels following last week’s $0.03/mile decrease. The national average dry van linehaul 7-day rolling average rate ended last week at $1.63/mile and remains around $0.06/mile above pre-pandemic levels for this time of the year. Based on the volume of loads moved, the average rate for the top 50 dry van lanes was $0.21/mile higher at $1.84/mile last week.


