The Spring 2023 Semiannual Economic Forecast by the Institute for Supply Management (ISM) forecasts the U.S. economy will continue to expand softly for the rest of 2023. The ISM expects the remainder of 2023 “are similar to those expressed in December 2022, despite continued inflation and geopolitical uncertainty”, according to Timothy R. Fiore, Chair of the ISM Manufacturing Business Survey Committee. The ISM report is compiled from responses to questions asked of approximately 900 purchasing and supply executives across the country across 18 key industries.
Survey respondents expect manufacturing revenue for 2023 to increase, on average, by 1.7%, which is 3.8% lower than the December 2022 forecast of 5.5%. Fiore said, ”Manufacturing continues its comeback from the turmoil that began in 2020 and is expected to continue through this year. With ten manufacturing sector industries expecting revenue growth in 2023 and 11 industries expecting employment growth in 2023, panelists forecast that recovery will continue the rest of the year, albeit somewhat softer than originally expected”.
Of the 18 industries tracked by the ISM, 14 expect revenue increases in 2023. Listed in the order they are: Arts, Entertainment & Recreation; Retail Trade; Professional, Scientific & Technical Services; Other Services; Agriculture, Forestry, Fishing & Hunting; Information; Transportation & Warehousing; Management of Companies & Support Services; Public Administration; Finance & Insurance; Accommodation & Food Services; Real Estate, Rental & Leasing; Educational Services; and Health Care & Social Assistance.
Market Watch
All rates cited below exclude fuel surcharges unless otherwise noted
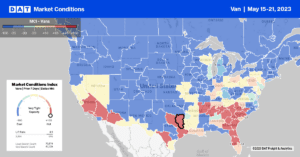
Dry van capacity predictably tightened last week in produce-growing regions as capacity migrates to higher-paying refrigerated loads of fruit and vegetables in the Southeast, on the West Coast, and along the southern border. In Los Angeles, dry van rates increased by $0.11/mile to an average outbound rate of $1.76/mile, while in neighboring Ontario, rates increased by the same amount to $1.85/mile. Linehaul rates on the benchmark lane from Los Angeles to the Stockton warehouse market 340 miles north, at $2.62/mile, are the highest since January and $0.13/mile higher than the April average. A similar trend was reported on the Los Angeles to Phoenix lane, where rates ended last week at $2.58/mile.
On the East Coast in Atlanta, linehaul rates jumped by $0.11/mile to $1.77/mile after mainly being flat for the prior few weeks. At $1.89/mile, Chicago outbound linehaul rates are $0.02/mile higher than the preceding month, with similar gains reported in Elizabeth, NJ, where outbound rates averaged $1.38/mile last week.
Load-to-Truck Ratio (LTR)
After a lackluster few months, load posts surged last week, increasing by 45%, and are now just 19% lower than the previous year. Carriers predictably took time off during International Roadcheck Week at about the same rate as last year, with equipment posts dropping by 16% w/w. The net result of last week’s 72-hour safety blitz was a capacity crunch resulting in a substantial increase in the dry van load-to-truck ratio (LTR) from 1.92 to 3.31.
Linehaul Spot Rates
After mainly being flat since the start of April, dry van linehaul spot rates surged as capacity tightened during the 72-hour safety blitz held last week. Linehaul rates increased by $0.07/mile to a national average of $1.69/mile. Based on the volume of loads moved the average rate for the top 50 dry van lanes was $0.22/mile higher at $1.91/mile last week.


