The recently released Retail Truck Tonnage Index highlights the extraordinary growth we’re seeing in the retail freight sector. It’s already up 6.3% year-over-year in March and 30% higher than before the pandemic.
“March of 2021 is the highest reading that we have seen outside of any holiday period in the Retail Truck Tonnage Index,” says Jason Miller, supply chain economist and co-creator of the Retail Truck Tonnage Index. “But we’re starting to see a change in consumer behavior, which is going to have major implications for carriers and freight networks.”
In contrast to all other retail sectors, which reported year-over-year gains in March, the Food and Beverage Retail Index was down 13%. This signals a possible shift in freight volumes and mix as consumers continue to spend more on clothing, furniture and electronics.
Find loads and trucks on the largest load board network in North America.

All rates exclude fuel unless otherwise noted.
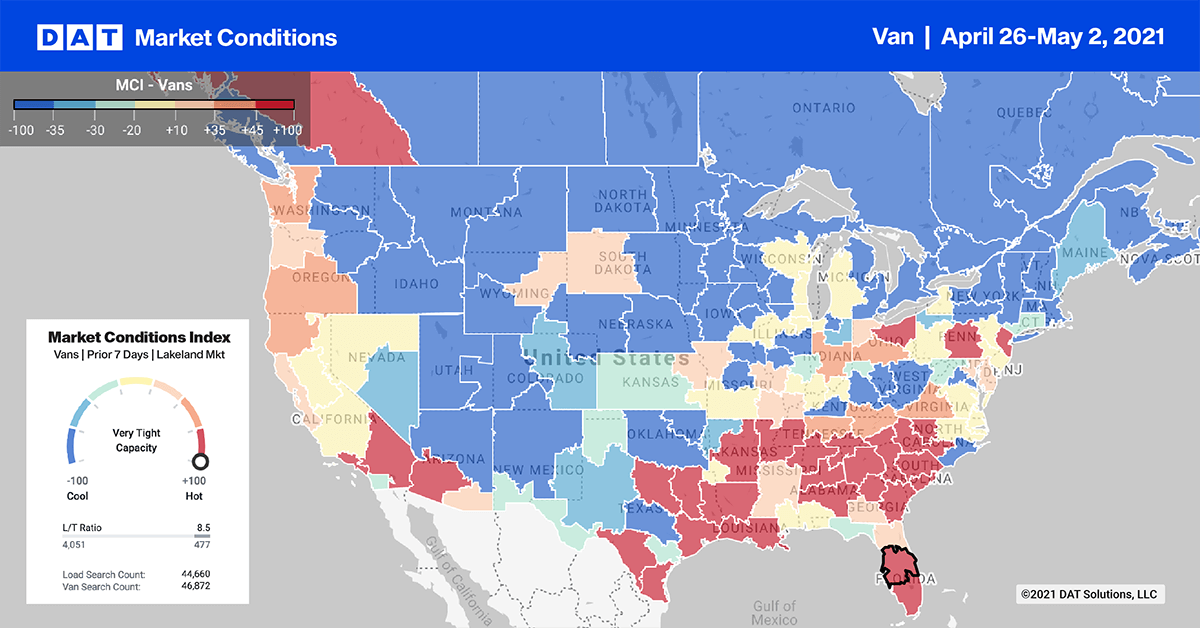
Average spot rates in the Top 10 markets dropped another $0.01/mile last week, although load post volumes were boosted 2% last week by end-of-month shipper volumes. The average rate dropped to $2.45/mile last week for the Top 10 markets.
Atlanta remained the number one spot market with a 9% increase in load post volumes, which pushed rates up slightly by $0.01/mile to $2.95/mile.
In Lakeland, FL, outbound rates were up $0.07/mile to $2.07/mile last week. Nearby Miami saw an increase of $0.11/mile to $1.90/mile. With all the flowers and vegetables coming out of Florida last week, it’s not surprising to see dry van rates tighten also.
Capacity tightened in the west. Ontario, CA, and Los Angeles both saw an increase of $0.01/mile to all destination markets. However, rates surged again to $4.54/mile on the 372-mile lane from L.A. to Phoenix, which is a major e-commerce/retail fulfillment lane. On the busy I-5 lane from L.A. to Stockton, CA, rates were up to $4.06/mile, which is $1.76/mile higher than this time last year.
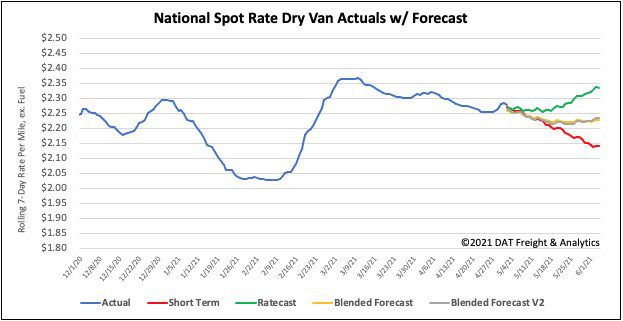
Spot rates forecast
Dry van spot rates dropped another $0.02/mile last week to end the last week of April at $2.29/mile. Compared to the same week in 2020, spot rates are now $0.94/mile higher and $0.46/mile higher than the same time in 2018.

How to interpret the rate forecast:
- Ratecast: DAT’s core forecasting model
- Short Term Scenario: Formerly the pessimistic model that focuses on a more near-term historical dataset
- Blended Scenario: More heavily weighted towards the longer-term models
- Blended Scenario v2: More heavily weighted towards the shorter-term models


