Istanbul, Mexico City, Chicago, New York, and Philadelphia comprise the most-congested urban areas in the 2025 Global Traffic Scorecard by Impact Rank (IR). The IR captures the aggregate influence of congestion relative to population. These results are due to their large populations and the increasing vehicular demand on their respective road networks. As the demand for vehicular travel continues to grow faster than the supply of roadway, traffic congestion and delay tend to grow.
On the individual commuter level, hours lost reflects the impact of congestion on the typical commuter on the roadway. In terms of hours lost, Istanbul, Chicago, and Mexico City drivers experienced the most delay, at 118, 112, and 108 hours, respectively. Big movers in 2025 include Philadelphia, PA, moving up 8 spots from 13th in 2024 to 5th in 2025. Dublin, Ireland moved up four spots to 11th.
Get the clearest, most accurate view of the truckload marketplace with data from DAT iQ.
Tune into DAT iQ Live, live on YouTube or LinkedIn, 10am ET every Tuesday.
The most significant upward shifts into the top 25 were seen in Turkey’s urban areas, with Ankara and Izmir debuting at 20th and 21st, respectively. Conversely, major cities in the U.S. and Europe, including New York, Los Angeles, London, and Paris, all dropped two places in the 2025 rankings. Warsaw, Poland, notably fell out of the top 25, finishing 30th in 2025.
Downtown Chicago, which is ranked as the third most congested city globally, has an average speed of only nine miles per hour. This is closely followed by New York at 11 mph and Philadelphia at 10 mph. Los Angeles completes the Top 10 with a downtown speed of 17 mph.
All rates cited below exclude fuel surcharges, and load volume refers to loads moved unless otherwise noted. The rate charts exclude 2021 and 2022, years influenced by the pandemic.
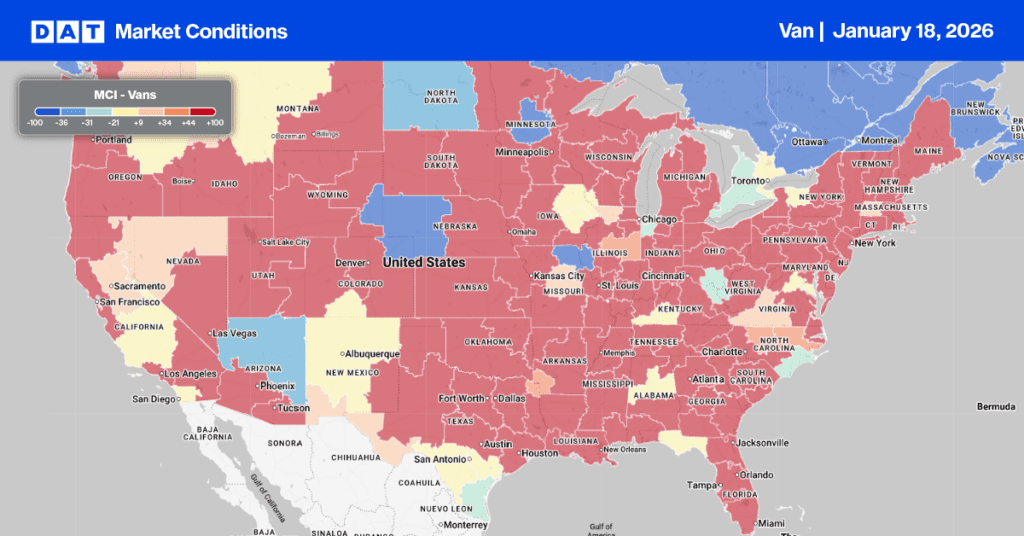
Following the prior week’s volume surge—likely a post-holiday catch-up—national dry van load post volumes cooled off last week. This resulted in a 25% weekly decrease in volumes. However, volumes remained nearly identical to the same period last year, causing the national load-to-truck ratio to drop by 29% to 7.06.
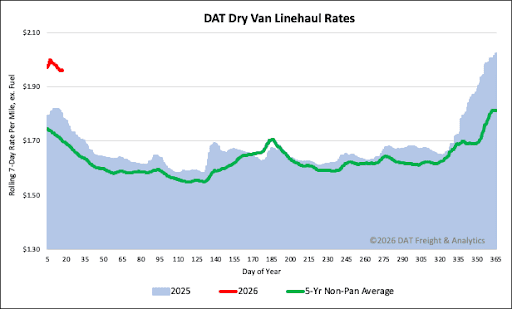
Dry van linehaul spot rates averaged $1.96 per mile last week, marking a $0.07 decrease. This follows a $0.02 per mile drop in the preceding week. Despite the recent declines, the current rate represents a substantial increase year-over-year, sitting $0.18 (10%) higher than the same week last year. Moreover, it is $0.26 per mile (13%) above the 5-year average, excluding the pandemic years.
The average rate for DAT’s top 50 lanes by load volume decreased by $0.11 per mile last week, averaging $2.29 per mile and $0.33 higher than the national 7-day rolling average spot rate.
In the 13 key Midwest states, which represent around 45% of national load volume and often indicate future national trends, spot rates decreased by $0.11 per mile to $2.37 per mile, which was $0.41 above the national 7-day rolling average.


