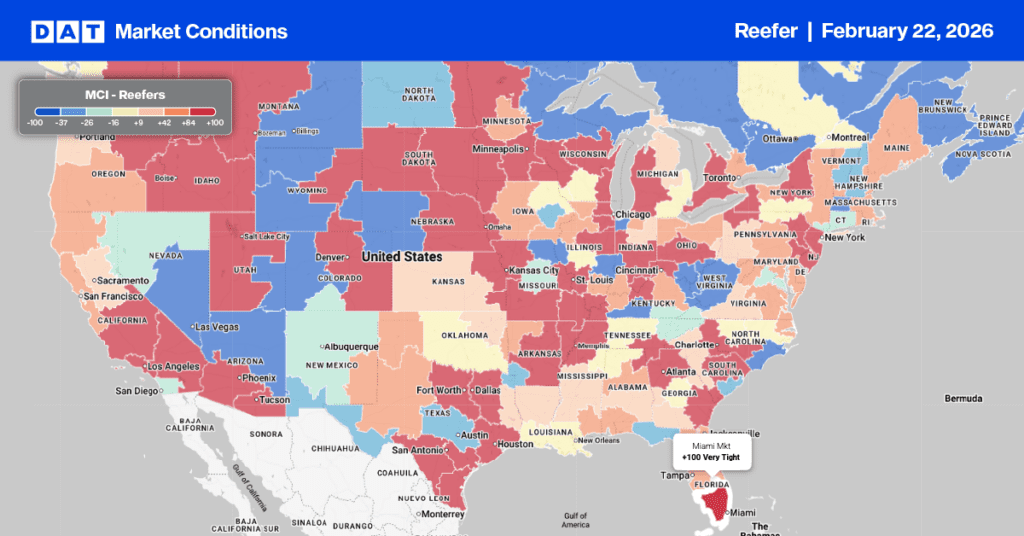
Last week’s story was Florida tightening fast. This week, it’s Florida giving it all back — and then some. Central and South Florida rates plunged 20–32% across every major destination, the sharpest single-week correction in the report. Meanwhile, California’s reefer capacity remains stubbornly tight, Nogales continues to soften, and South Texas is mixed with one lane spiking. The produce market just reshuffled the deck.
Get the clearest, most accurate view of the truckload marketplace with data from DAT iQ.
Tune into DAT iQ Live, live on YouTube or LinkedIn, 10am ET every Tuesday.
The Florida rate surge we flagged last week was short-lived. Every lane out of Central and South Florida posted double-digit declines, with truck availability loosening from Shortage to Slight Shortage across the board.
Mexico crossings through Nogales posted another week of declines, with rates down -3% to -7% to most destinations. Truck availability remains Adequate. The Atlanta lane saw the steepest drop at -7%, while LA held flat. This is now the second consecutive week of softening out of Nogales — the trend is clearly directional.
California’s produce regions remain in Shortage across Imperial/Coachella, Kern, Oxnard, and Santa Maria districts. Rates were mostly flat to slightly softer (-1% to -2%), consistent with the pattern we’ve seen for several weeks — tight capacity that isn’t translating into rate acceleration.
Mexico crossings through South Texas shifted from last week’s Slight Surplus to Adequate across most lanes, suggesting some tightening.
Watch next week: Does Florida stabilize at these lower levels or continue to slide? The Nogales softening trend also bears watching — two weeks of consecutive declines could signal a broader pattern heading into late February. And keep an eye on California: Shortage conditions that don’t produce rate increases eventually resolve one way or the other.
Source: USDA AMS Specialty Crops National Truck Rate Report, February 18, 2026. Rates represent open (spot) market per-load prices including broker fees for 48–53 ft. refrigerated trailers of produce from the major growing regions to ten destination cities, including Atlanta, Baltimore, Boston, Chicago, Dallas, Los Angeles, Miami, New York, Philadelphia, and Seattle. Week-over-week changes measured against February 10, 2026 report.
Reefer Market Conditions
Reefer load posts dropped for the fourth consecutive week, a 13% decrease in the load-to-truck ratio to 14.60. This drop follows last week’s 18% plunge in volume and was likely influenced by a 15% week-over-week decrease in produce volume after the Valentine’s Day floral surge. Despite the recent decrease, load volumes remain strong—40% above last year and 77% higher than the 10-year average (excluding the 2021 and 2022 pandemic years). Simultaneously, the availability of equipment declined, with available equipment posts falling 6% week over week and 20% year over year.
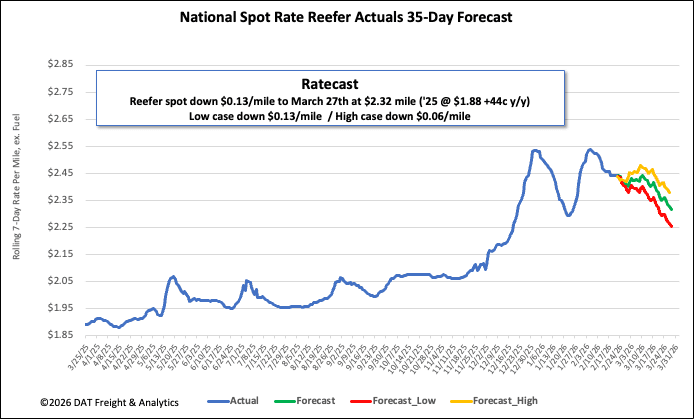
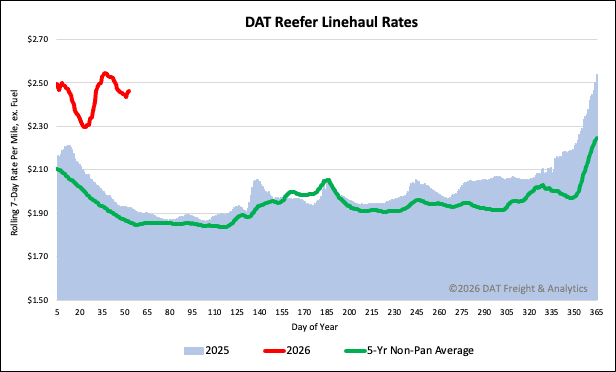
National reefer linehaul spot rates
Reefer posted rates have declined for the second consecutive week, dropping a total of $0.11 per mile, including a $0.07 per mile dip last week. This reduction has eliminated half the gains realized from Winter Storms Fern and Gianna. Despite the recent cooling, the national average reefer spot rate, excluding fuel, remains high, settling at $2.46 per mile. This rate is significantly elevated compared to both last year and historical averages, sitting $0.53 per mile (28%) above the rate for the same period last year and surpassing the 5-year average (excluding pandemic years) by $0.60 per mile, or 24%.