In early 2026, the American Iron and Steel Institute reported U.S. raw steel production running modestly ahead of the same period in 2025. Weekly output in the most recent report was approximately 1.78 million net tons, compared to about 1.70 million net tons during the comparable week last year — a year-over-year increase of roughly 5%. Year-to-date production through early February 2026 is tracking just under 8 million net tons, up from the mid-7 million net ton range at the same point in 2025. Capacity utilization has also firmed slightly, hovering in the mid- to upper-70% range versus the low- to mid-70s a year ago. Shipments for the full year 2025 are 90,953,066 net tons, up 4.9 percent vs. 2024 full year shipments of 86,698,917.
Get the clearest, most accurate view of the truckload marketplace with data from DAT iQ.
Tune into DAT iQ Live, live on YouTube or LinkedIn, 10am ET every Tuesday.
It’s not a boom, but it is a measurable acceleration — and in freight markets, marginal gains in heavy industry matter. A major anchor of that output remains Gary Works in Gary, Indiana, which is also a major flatbed market in the DAT freight network where outbound volumes are 43% higher year over year; spot rates are also up, 24% higher than the same time a year ago.
Flatbed Market Conditions
Flatbed load post volumes held steady last week, nearly unchanged at 1.23 million loads, following four consecutive weeks of increases. This volume remains robust, sitting almost 50% higher than the same period last year. A 5% drop in equipment posts led to a corresponding 5% rise in the flatbed load-to-truck ratio, pushing it to 59.00.
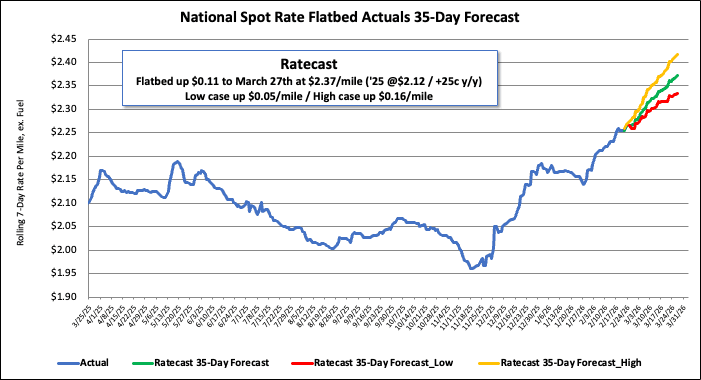
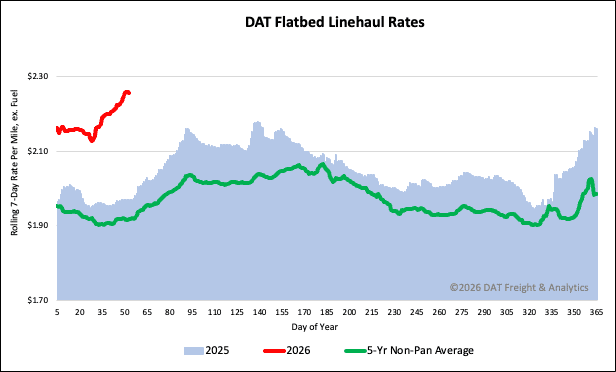
National flatbed spot rates
The national average spot rate for flatbed linehaul has increased for the fourth week in a row, settling at $2.26 per mile last week. This represents a $0.02 per mile gain from the previous week. This current rate is notably strong: it is $0.29 per mile (15%) higher than the rate recorded in the same period last year, $0.24 per mile above the 2018 level, and $0.34 per mile (15%) higher than the 5-year average (excluding years affected by the pandemic).