Depending on who you talk to, the economy is headed for a recession or, more recently, a “soft landing,” as outlined by the National Retail Federations (NRF) June edition of the Monthly Economic Review. In the last year, we’ve heard economic pundits describe the state of the economy using terms such as the U.S. is slowing to stall speed, potentially choppy investing waters ahead, or the economy faces significant headwinds. But the latest report from the NRF sums things up best with reference to a device invented over 200 years ago, the kaleidoscope.
NRF Chief Economist Jack Kleinhenz states, “Today’s economy is a lot like looking into a kaleidoscope, with the view changing and the data providing a different reflection of what’s happening every time you look. Depending on which data you view in the economic kaleidoscope, you get two different angles on the state of the consumer. While survey data shows consumers lack confidence in the economy, actual spending data shows they were upbeat as the second quarter kicked off.” He said economic indicators are giving conflicting signs. Still, the nation is not in a recession and should be headed toward a soft landing from the past two years’ rampant inflation and high-interest rates.
For dry van carriers, the strength of the American consumer is a crucial indicator of future freight demand. As it did during the pandemic, it is poised to lift overall freight demand in the spending half of this year. According to Kleinhenz, “Consumer spending has been bolstered by a strong job market and rising wages, which have helped counter rising prices and higher borrowing costs. While it’s difficult to reconcile these views, what we’ve learned over the last several years is don’t count the American consumer out, at least not yet.”
Market Watch
All rates cited below exclude fuel surcharges unless otherwise noted.
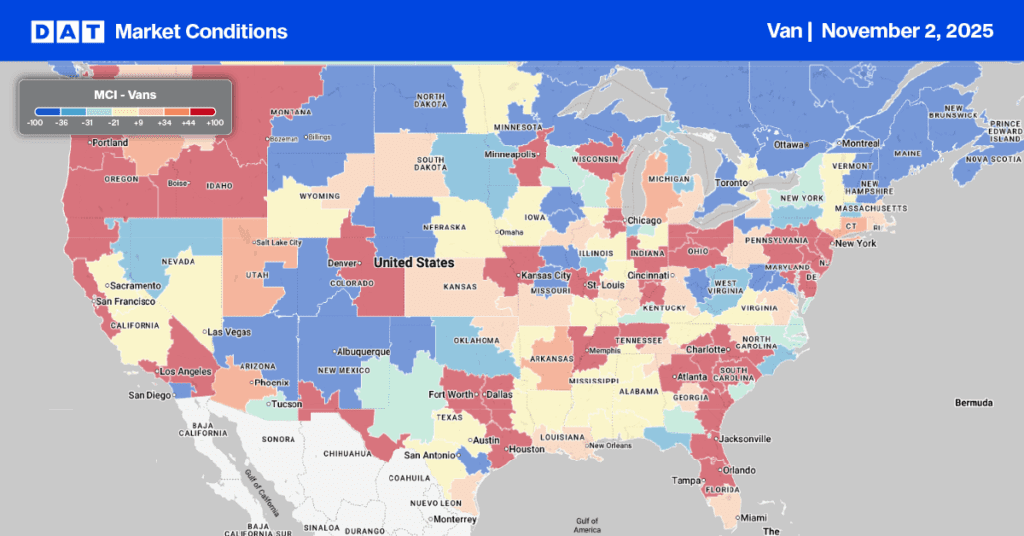
Our MCI reported that capacity continues to tighten along the southern border for the fifth week, especially in the Southwest and West Coast, where combined regional rates increase by $0.02/mile to an average of $1.86/mile. Solid gains were reported in Arizona for outbound loads, which averaged $1.69/mile, up $0.07/mile w/w. Dry van capacity was tight in the Flagstaff market, where outbound rates jumped $0.23/mile to $1.98/mile. Loads west to Los Angeles were paying $1.56/mile, the highest since January, and $0.14/mile higher than last month. Flagstaff to Ontario was slightly higher at $1.61/mile, $0.21/mile higher than the previous month.
Outbound California dry van spot rates reflect the lower import volumes, which were 20% lower than the previous year in the Ports of Los Angeles and Long Beach, where a third of the nation’s imported containers arrive. At $2.09/mile, California outbound spot rates were $0.01/mile higher last week, $0.14/mile higher than in 2019. Loads moved from Los Angeles to the two major spot market destinations, Stockton and Phoenix, have been increasing steadily for the last few weeks resulting in spot rates increasing on the Stockton lane to $2.75/mile, up by $0.11/mile over the May average and the highest since last October. In contrast, capacity loosened on the Los Angeles to Phoenix lane, where spot rates averaged $2.58/mile, down $0.13/mile on the May average.

Load-to-Truck Ratio (LTR)
Spot market volumes were at the lowest level in seven years following last week’s 4% w/w decrease. Load posts were 16% lower than in 2019, the next closest year going back to 2016. Dry van volumes have dropped 22% since Mother’s Day. Carrier equipment posts increased slightly last week, decreasing the dry van load-to-truck ratio (LTR) from 2.41 to 2.28.
Linehaul Spot Rates
Dry van linehaul rates have been flat since Roadcheck Week, which occurred right after Mother’s Day. There was minimal movement in linehaul rates last week, with the national average hovering around $1.70/mile for the fifth week. Compared to our Top 50 lanes, which averaged $1.99/mile last week, the national average was $0.29/mile lower.


