The U.S. truckload market continued its decline in May 2025, with the ACT Research Volume Index falling to 42.5 for the third straight month. This ongoing softness is primarily due to the disruptive effects of tariffs and uncertain future trade policies, which have hindered business planning and slowed economic activity. While consumer spending has held steady, tariff-driven inflation is projected to curb purchasing power, leading to reduced freight volumes. A natural market correction is also underway, following a pull-forward of freight shipments into the first quarter.
Get the clearest, most accurate view of the truckload marketplace with data from DAT iQ.
Tune into DAT iQ Live, live on YouTube or LinkedIn, 10am ET every Tuesday.
Pricing saw a brief increase in May, reaching 47.8 as capacity tightened during the DOT’s Roadcheck inspection week. However, this was temporary, with spot rates quickly reverting to pre-Roadcheck levels. The market continues to face difficulties from slower freight growth and elevated equipment costs, which are a result of tariffs on steel, aluminum, and parts. Many fleets, dealing with slim profit margins and economic uncertainty, have halted or scaled back new equipment acquisitions, further constraining capacity growth.
Driver availability remains relatively robust, with the Driver Availability Index at 50.9, supported by increased wages and experienced drivers rejoining fleets. Despite this, investment in driver training is suffering due to poor profitability. Fleet purchase intentions are at a historic low, with only 27% planning near-term new equipment purchases, reflecting a cautious outlook amidst regulatory and economic uncertainty. Overall, the supply-demand balance remains loose, as decreasing freight volumes outpace capacity reductions, indicating persistent challenges for the truckload market in the near future.
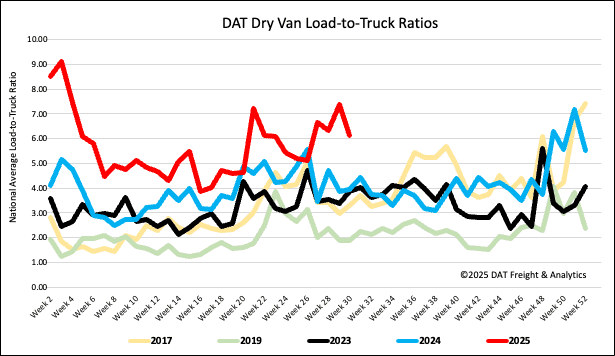
Load-to-Truck Ratio
Following the prior week’s post July Fourth surge, load post volumes retreated last week, decreasing by 17%. Volumes are still 13% higher than last year, however. Carriers re-entered the market in full force, increasing equipment posts by 3% resulting in the dry van load-to-truck ratio decreasing by 17% to 6.12.
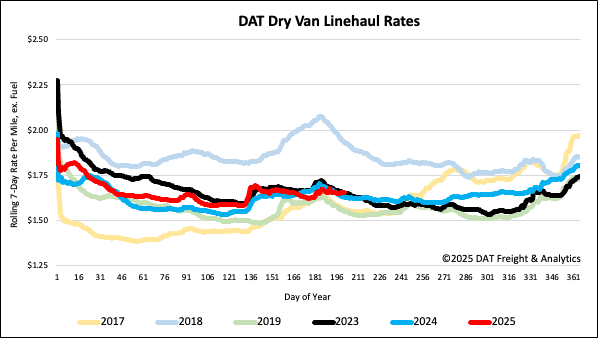
Linehaul spot rates
Dry van linehaul spot rates saw a $0.03 decrease last week, the largest decrease since the start of April. At $1.66 per mile, dry van rates remained $0.03 higher than the same time last year.
The average rate for DAT’s top 50 lanes by load volume decreased $0.02 per mile to $2.01 per mile and $0.35 higher than the national 7-day rolling average spot rate.
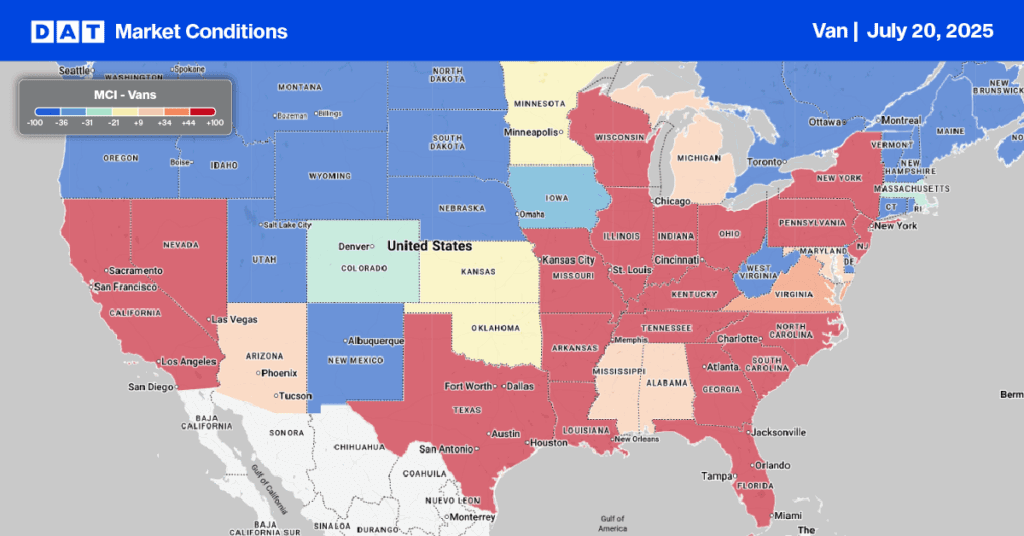
In the 13 key Midwest states, which represent 46% of national load volume and often indicate future national trends, spot rates fell by $0.08 per mile despite a 36% higher volume of loads moved. Carriers in these states earned an average of $1.89 per mile, which is $0.23 above the national 7-day rolling average.