Baltimore has 110 million people, or ⅓ of the US population, within a 500-mile radius or a day’s drive by truck and is a key freight hub for many shippers, brokers, and carriers. The bridge collapse in Baltimore following last week’s collision with the Maersk-operated container vessel “Dali” has resulted in the closure of the Port of Baltimore and the main traffic artery to the south in Interstate 695.
Get the clearest, most accurate view of the truckload marketplace with data from DAT iQ.
Tune into DAT iQ Live, live on YouTube or LinkedIn, 10am ET every Tuesday.
The longer-term impact on freight markets remains to be seen as shipping lines divert cargo vessels to nearby ports, with Norfolk and New York being the most likely recipients of the additional volume of containers and roll-on/roll-off freight. The immediate impact should be reducing outbound freight volumes on key freight lanes from Baltimore to the west, including Chicago, South Bend, and Indianapolis. Carriers forced to reposition equipment to other markets will take time and add cost, especially considering Baltimore is the furthest port inland on the East Coast, some 150 miles further than New York City.
As of late last week, Transportation Secretary Pete Buttigieg met with supply chain professionals to discuss the crisis and how to mitigate congestion. The Port of New York/New Jersey, Georgia, Baltimore, Philadelphia, Jacksonville, South Carolina, and Virginia were also in attendance. Shipping clients at the meeting included John Deere, Stellantis, Home Depot, Under Armour, and Volkswagen.
“We are much better equipped to mitigate supply chain disruptions than we were just a few years ago, thanks to increased coordination across the supply chain and new efforts to strengthen both our physical and digital infrastructure,” Buttigieg said.
Market watch
All rates cited below exclude fuel surcharges unless otherwise noted.
From a freight market perspective, Baltimore is not a major dry van truckload freight market, ranking 29 out of 135 spot markets last week. Following the bridge collapse last week, the impact on the dry van spot market saw capacity loosen – outbound Baltimore spot rates were down slightly, dropping by $0.02/mile to $1.33/mile on a 12% higher week-over-week (w/w) volume of loads moved. Maryland’s state average spot rate at $1.51/mile dropped $0.02/mile last week, identical to this time in 2019.
On the number one long-haul lane west to Chicago, loads moved decreased by 18% while linehaul rates increased by $0.01/mile, averaging $1.03/mile last week, slightly lower than the 12-month average for this 700-mile haul. On the number two lane to South Bend, IN, loads moved were down 6% w/w while linehaul rates increased by $0.04/mile to $1.14/mile. The number three lane to Indianapolis saw volumes increase by 13% w/w, with spot rates increasing by $0.09/mile to $1.29/mile.

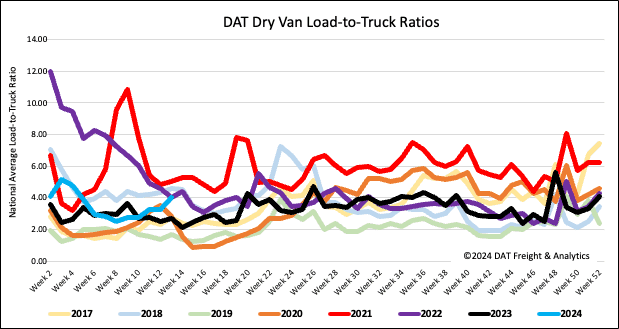
Load-to-Truck Ratio
Dry van load post volume increased by 6% last week, up 17% month-over-month (m/m) and 3% year-over-year (y/y). Ongoing interstate carrier exits from the industry result in decreased available capacity following last week’s 13% drop in equipment posts, increasing the load-to-truck ratio by 22% to 4.00.
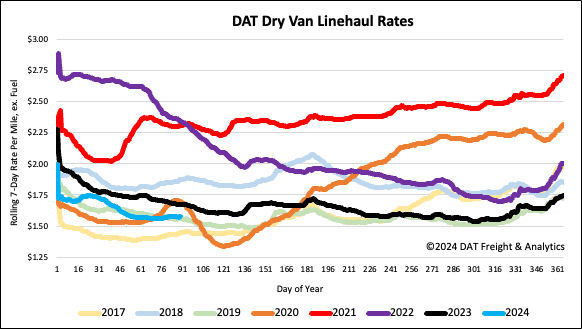
Linehaul spot rates
The national average dry van linehaul rate remained flat last week at $1.59/mile, $0.10/mile lower than last year, and just $0.02/mile higher than 2019. Based on the volume of loads moved, DAT’s Top 50 lanes averaged $1.88/mile last week, $0.29/mile higher than the national average.