The first quarter, or “Quiet Season” in freight, is also impacted by a slowdown in Asian imports. Except for 2020, February import volumes are typically the low point each year before picking up in March and then steadily increasing to October, when import volumes usually peak. According to IHS Markit/PIERS data, February volumes decreased around 20% compared to January due to the Chinese New Year (CNY) and the closing of factories. This year, celebrations will last up to 16 days, but only the first seven days are considered a public holiday (February 10th–February 16th, 2024).
Get the clearest, most accurate view of the truckload marketplace with data from DAT iQ.
Tune into DAT iQ Live, live on YouTube or LinkedIn, 10am ET every Tuesday.
Chinese New Year is celebrated by more than 20% of the world and is the most important holiday in China and to Chinese people all over. Traditionally, the week before and after the week-long festival is set aside so family members can travel home for New Year’s dinner. This effectively shuts down most factories for three weeks, resulting in a drop in import volumes, especially on the transpacific trade lane, North America’s most prominent trade lane.
Imports from Asia on the transpacific ocean shipping lane accounted for 68% of November’s total import volume, just over half coming from North East Asia, where the Ports of Yantian, Shanghai, and Ningbo account for 54% of imports into the U.S. Los Angeles and Long Beach ports received 50% of twenty-foot equivalent units (TEU) from North East Asia last month impacting truckload demand in southern California the most during CNY.
Market watch
All rates cited below exclude fuel surcharges unless otherwise noted.
In DAT’s Top 5 spot markets, including Atlanta, Chicago, Dallas, Elizabeth, and Los Angeles, linehaul rates increased by $0.01/mile to an average of $1.70/mile last week. Solid gains were reported in Texas, where average outbound rates were $0.05/mile higher at $2.07/mile. Linehaul rates in the Dallas/Fort Worth area also increased by $0.05/mile, paying carriers an average of $1.57/mile on a 7% higher volume of moved loads. Capacity continues to ease in Los Angeles, with spot rates down for the third week, averaging $1.80/mile, around $0.10/mile lower than in 2020.
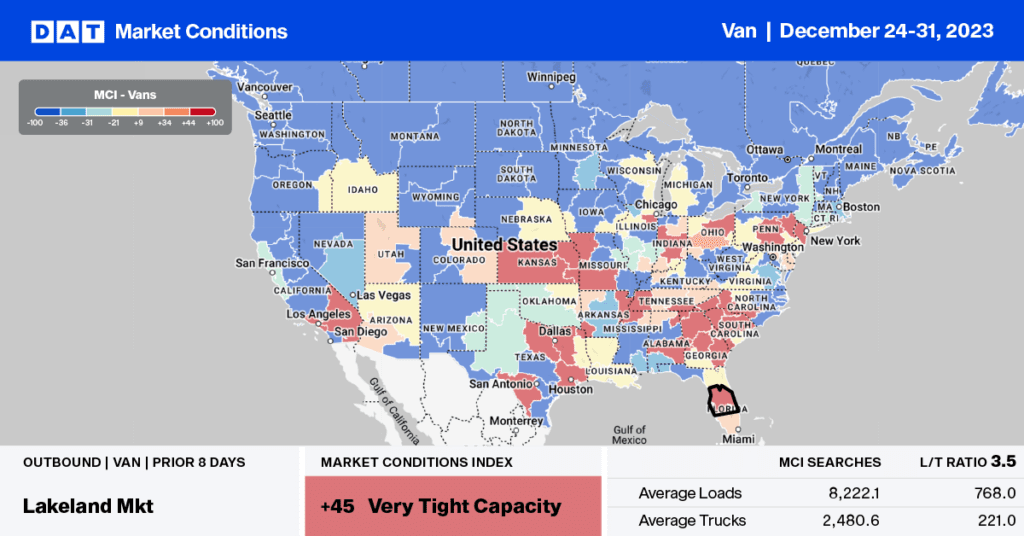
Chicago outbound rates were up for the fourth week, averaging $2.03/mile, around $0.20/mile lower than the start of 2020. In the large Southeast distribution market in Atlanta, spot rates increased by $0.01/mile to an average outbound rate of $1.65/mile, but paid carriers much more on the high-volume Lakeland lane, where spot rates averaged $2.45/mile last week.
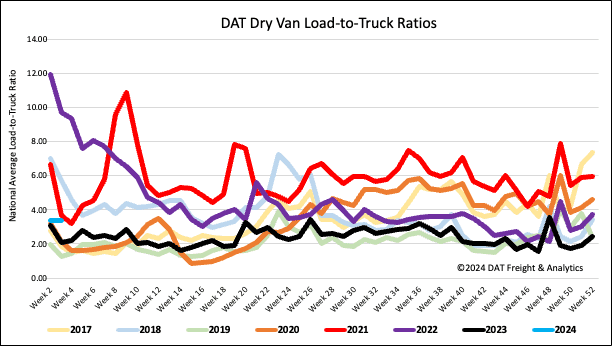
Load-to-Truck Ratio (LTR)
Spot market load post (LP) volumes continue to track around half what they were a year ago and 19% below the long-term average for the first week on the shipping calendar. As we start the new year, there are fewer carriers in the spot market following 15 months of carrier exits, leaving equipment posts (EP) for those that remain around 30% lower than last year and 25% lower than the long-term average for Week 1. Last week’s dry van load-to-truck ratio (LTR) was 3.37.
Linehaul spot rates
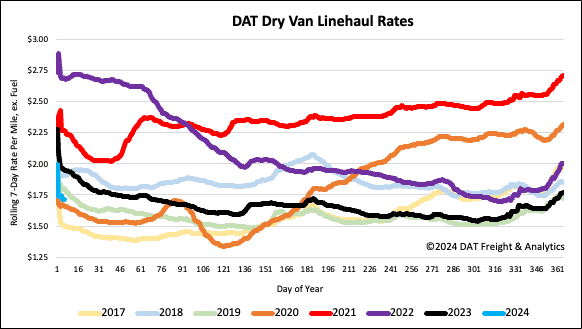
Dry van linehaul rates ended in 2023 at just over $1.75/mile, almost precisely where Ratecast forecast linehaul rates predicted they’d be. Since then, spot rates have decreased by $0.03/mile to $1.73/mile, $0.23/mile lower than last year and $0.05/mile higher than at the start of 2020. DAT’s Top 50 lanes, based on the volume of loads moved, averaged $2.05/mile last week, maintaining the $0.30/mile spread.