The results from last year’s Operation Safe Driver Week give carriers and drivers of preview of what’s in store this year. Last July, Canadian and U.S. officers pulled over more than 35,000 commercial motor and passenger vehicles. They issued 26,164 warnings and citations to commercial motor vehicle drivers and passenger vehicle drivers engaging in unsafe driving behaviors, ranging from speeding to distracted driving.
Speeding was the focus last year and was the top violation – in warnings given and citations issued – for both types of drivers. Officers issued 8,586 citations and 7,299 warnings for speeding/violating basic speed law/driving too fast for conditions. Broken out, that amounts to 2,577 warnings to commercial motor vehicle drivers and 4,722 to passenger vehicle drivers. According to the National Highway Traffic Safety Administration (NHTSA), speeding has played a role in more than a quarter of traffic deaths – killing nearly 100,000 people – over the past decade. In 2020 alone, there were 11,258 speeding-related deaths in the U.S. According to Transport Canada, speeding/driving too fast was a contributing factor in 25.3% of fatal crashes in 2020.
According to the Federal Motor Carrier Safety Administration’s latest Seat Belt Usage by Commercial Motor Vehicle Drivers Survey, the overall safety-belt usage rate for drivers of medium- and heavy-duty trucks and buses is 86.1%. According to NHTSA, the seat-belt usage rate for the average passenger vehicle driver was 90.4% in 2021. However, during Operation Safe Driver Week, failure to wear a seatbelt was the second-most issued citation category – with 1,156 citations given to passenger vehicle drivers and 735 to commercial motor vehicle drivers.
Market Watch
All rates cited below exclude fuel surcharges unless otherwise noted.
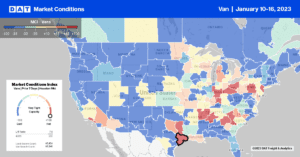
Houston was the only Top 10 spot market to post a gain last week, increasing by 6% w/w to hold onto the number one spot for load post volume. Available capacity was not impacted significantly, with spot rates decreasing by just $0.02/mile to $1.84/mile. Overall Top 10 market volumes, which represented 24% of total volume last week, decreased by 11%, with notable declines in Joliet and Chicago, where volumes dropped 16% and 29% w/w, respectively. Outbound linehaul rates in both markets dropped by $0.08/mile to $2.50/mile.
Even though Flagstaff, AZ, is a small spot market, capacity was tight, following an 18% w/w increase in load posts. Average outbound spot rates increased by $0.13/mile to $1.90/mile, with notable gains on the 1,100-mile haul to Pendleton, OR, where spot rates averaged $2.38/mile, up $0.28/mile on the December average. In California, where residents are bracing for another round of storms this week, state-level spot rates dropped by $0.02/mile to $2.17/mile, the lowest in four years. Although load posts in Los Angeles and Ontario surged last week, increasing by 18%, there was sufficient capacity to meet demand, pushing down spot rates by $0.04/mile to $1.94/mile for outbound loads. On the high-volume lane from Los Angeles to Stockton, spot rates at $2.84/mile were just under $0.10/mile higher than in December but a whopping 38% or $1.74/mile lower than the same time last year when a record high 109 container ships were waiting to unload.
Load-to-Truck Ratio (LTR)
Last week saw truckload capacity fully return to the freight network following the holiday break resulting in a 60% w/w surge in carrier equipment posts. Compared to the week two average for equipment posts over the last six years, last week’s volume was 51% higher. Load post volumes also spiked, increasing by 21% ahead of this week’s short work week following Martin Luther King Day. Volumes were within 1% of 2021 levels last week and the third highest in six years for the second week of the shipping year. As a result, last week’s dry van load-to-truck ratio (LTR) decreased slightly from 5.56 to 4.20.
Linehaul Spot Rates
The national average dry van rate decreased by $0.02/mile last week to $1.93/mile, which is 30% or $0.81/mile lower than the previous year. At $1.93/mile, dry van linehaul rates are just $0.04/mile lower than in 2018 and $0.24/mile higher than in the prior five pre-pandemic years for the second shipping week of the calendar year. The national average linehaul rate was $0.29/mile lower than the top 50 dry van lanes based on the volume of loads moved, which averaged $2.22/mile last week.


