The Columbus freight market, the largest of four in Ohio, is poised to become an even larger one for truckload carriers following a series of major construction projects. According to U.S. Commerce Department officials, Intel’s decision to build two factories near Columbus is becoming one of two semiconductor manufacturing clusters being developed as part of the federal CHIPS Act. President Biden picked Columbus as one of five workforce hubs in May to fully capitalize on federal investments in semiconductors, clean energy, and electric vehicles.
Geography plays a significant role in the emerging dominance of the Columbus market. Located along Interstates 70 and 71 on the eastern side of the Midwest Region, four key freight regions totaling 140 million people can be reached within a day’s drive by truck – the large Midwest, Eastern Canada, the Northeastern United States, and the Mid-Atlantic Region. The region is home to intermodal facilities operated by CSX and Norfolk Southern.
Get the clearest, most accurate view of the truckload marketplace with data from DAT iQ.
Tune into DAT iQ Live, live on YouTube or LinkedIn, 10am ET every Tuesday.
Ranked the 12th largest spot market in the DAT freight network, Columbus accounts for 2% of weekly volume. It’s also a balanced freight market with roughly the same number of loads entering and leaving daily. Top outbound destinations include Chicago, Joliet, Atlanta, Allentown, and Elizabeth, NJ.
Market watch
All rates cited below exclude fuel surcharges unless otherwise noted.
Dry van spot market truckload volume has recently increased following the 12.5% increase in containerized import volume in the Elizabeth, NJ, market in December. Import volumes in the Port of New Jersey and New York are 8% higher than last year, contributing to last week’s 12% increase in the volume of loads moved. Load post volumes were up for the fourth consecutive week, following last week’s 20% w/w increase, pushing the Elizabeth market to the number one position. Average outbound linehaul rates were up $0.07/mile to $1.49/mile after decreasing for the three weeks prior.
Outbound average spot rates in Chicago increased by $0.05/mile to $2.17/mile last week and have steadily climbed since the start of December. The volume of loads moved in Chicago is up 11% y/y, with spot rates up 5% y/y. State average Illinois spot rates are around $0.05/mile higher than last year, and unlike in past years when rates typically drop in the first quarter, this year they’re going against the trend much like they did in 2018 when linehaul rates increased by around $0.15/mile in January. They are on track to do much the same this year.
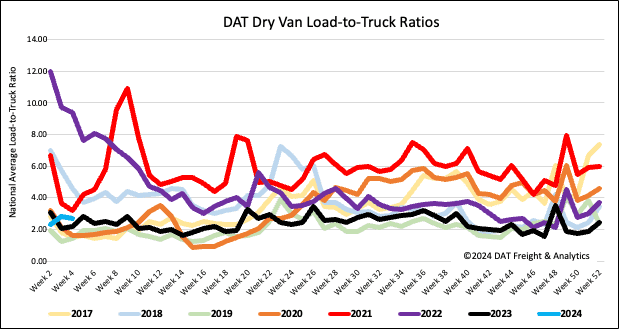
Load-to-Truck Ratio (LTR)
Freight volumes returned to more normal levels last week following the prior week’s impact from the extreme cold. Spot market load post (LP) volumes decreased by 5% w/w, within 17% of last year’s volumes, while carrier equipment posts (EP) were flat. This resulted in last week’s dry van load-to-truck ratio (LTR) decreasing by 5% to 2.70.
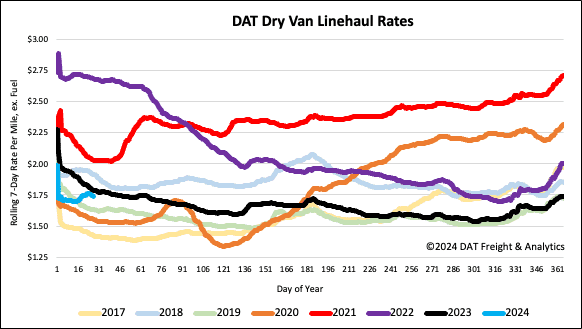
Linehaul Spot Rates
Dry van linehaul rates were flat last week, remaining around a national average of $1.74/mile. Compared to last year, linehaul rates are $0.05/mile lower. Based on the volume of loads moved DAT’s Top 50 lanes averaged $2.03/mile last week, $0.29/mile higher than the national average.