By Christina Ellington, DAT iQ
Loadlink Technologies’ Canadian spot market continues to grow this March, though the rapid rate of growth we have been experiencing the last few months seems to have plateaued. Compared to last March, volumes saw a prominent increase of 125 percent year-over-year and exceeded this February’s all-time record by an additional 11 percent.
“As a result of backlogs from border blockades and vaccine mandates, late February and early March load volumes spiked by 20%. While still high, load volumes shrank by nearly the same amount towards the end of the quarter, while available trucks increased slightly.” says Claudia Milicevic, president of Loadlink Technologies.
March trade performance by Statistics Canada indicates continued growth in imports and exports for Canada, with both imports and exports reaching record highs:
- The growth of imports in motor vehicles and parts rose 9.9% in March.
- Exports to the United States increased by 7.7% in March, primarily due to higher crude oil exports.
- Imports from the US increased by 5.4% and were driven by energy products, motor vehicles, and parts.
MARCH SPOT FREIGHT HIGHLIGHTS
- March’s truck-to-load ratio was 0.68, 53 percent lower than the ratio of 1.44 in March 2021.
- The strains on capacity are still very apparent, though this is the first time we have seen capacity grow in many months.
- Loads continue to surpass historical trends – volumes have climbed 125% since March 2021.
- Outbound Cross-border Activity
- Truckloads shipping across the border from Canada to the United States soared 237 percent from this time last year. Equipment postings were down 44% y/y.
- Inbound Cross-border Activity
- Inbound loads rose 9% m/m compared to last month and 99% y/y. Equipment postings were down 33% y/y and 23% m/m.
This week we’re taking a look at two intra-Canada lanes connected to the automotive industry – Detroit and Laredo, TX, to Toronto, where there is evidence capacity is returning to these lanes. On the longer-haul lane from Laredo to Toronto, more commonly known as “auto alley,” dry van rates typically average close to $1.50/mile excl FSC, but that was up until the February blockades in Canada. As a result, dry van rates northbound from Laredo into Canada jumped by 41% to $2.37/mile excl. FSC at the end of February and then increased by another 27% to $3.02/mile excl. FSC by the end of April. This week spot rates are down 9% to $2.75/mile excl. FSC. A similar trend was observed on the Detroit to Toronto lanes, where spot rates typically sit around $640/load excl FSC. Load rates jumped by 30% to $1060/load excl. FSC during the blockades. FSC then increased by another 19% to $1,251/load excl. FSC at the end of April. This week’s rates are down 13% to $1,085/load.
Augusta, ME, is not a large freight market, but it’s significant compared to the empty miles carriers have to factor in between loads. This was evident with record-high diesel prices last week as capacity tightened, driving up outbound spot rates by $0.28/mile to $2.40/mile excl. FSC. Capacity was also tight in the Flagstaff, AZ, market, where spot rates jumped by $0.29/mile to an average of $2.22/mile excl. FSC after decreasing for the three weeks prior. In the Southeast, where produce season is underway, dry van capacity tightened as reefer carriers switched to higher-paying loads of produce – dry van rates increased to an outbound average of $2.02/mile excl for the third week. FSC. On the West Coast in Los Angeles, spot rates for loads to Chicago continue to drop and are now $0.68/mile lower y/y at $1.73/mile excl. FSC this week.
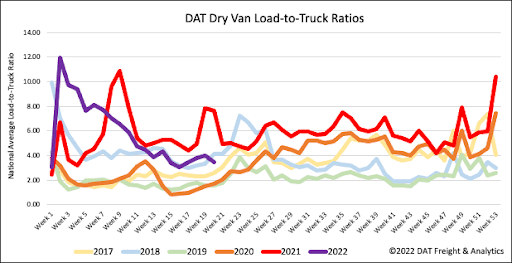
Dry van load post volumes continue to track with 2018 from a demand perspective, while equipment posts are tracking the closest with 2019 and 2020 – both down years for truckers. Load post volumes dropped 8% last week and are now 42% lower than last year. Equipment posts jumped 6% w/w after being relatively flat for two weeks. As a result, the dry van load-to-truck ratio dropped by 14% w/w from 4.01 to 3.44.
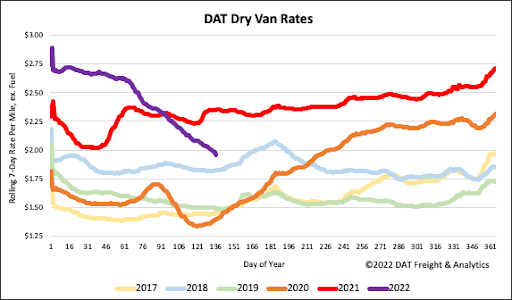
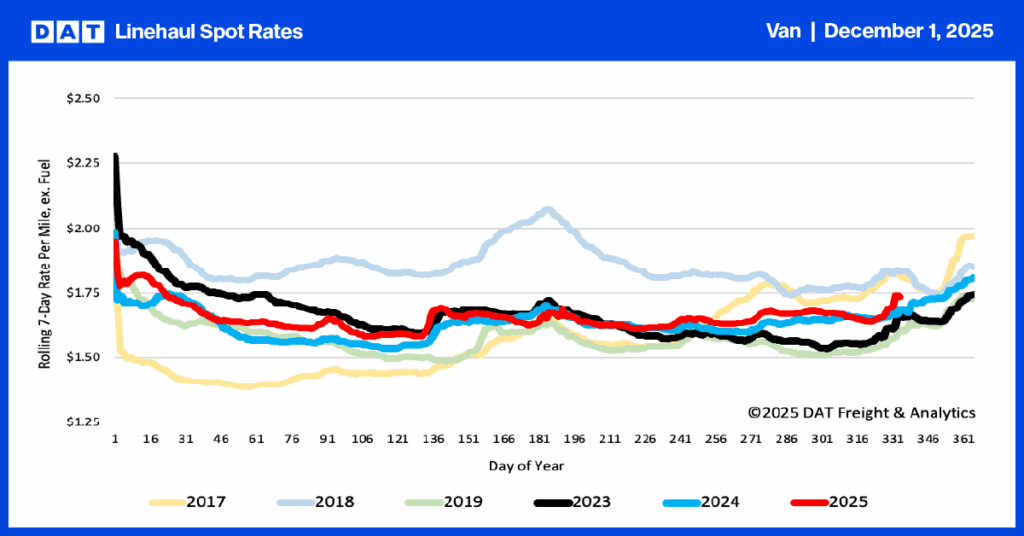
Dry van spot rates have been dropping by an average of $0.05/mile each week for the last seven weeks and are now at $2.00/mile excl. FSC or about the same level right before last year’s Polar Vortex upended the freight market. Spot rates are currently $0.39/mile lower than the previous year and just $0.14/mile higher than the same week in 2018.