Inbound truckload spot market volumes into Ft. Worth, TX, have increased by 23% since 2019, driven primarily by the surge in imports into the Gulf Coast as shippers diverted freight volumes away from the congested West Coast during 2021 and 2022. Houston, the fifth largest import port, recorded a 25% increase in December containerized volume compared to the prior year, the highest December since 2018. Ft. Worth is rapidly becoming a warehouse distribution market, with inbound loads from Houston consistently the highest volume spot market lane.
Get the clearest, most accurate view of the truckload marketplace with data from DAT iQ.
Tune into DAT iQ Live, live on YouTube or LinkedIn, 10am ET every Tuesday.
The second-highest inbound lane to Ft. Worth is from Memphis, another large distribution warehouse market known as the Logistics Capital of America. Ft. Worth is increasingly becoming a more balanced freight market for truckload carriers, with 8% more outbound loads than inbound. Combined with the larger, balanced Dallas freight market in close proximity, the volume of loads moved into the Dallas/Ft. Worth region is up 6% y/y, while outbound loads are up 8.4% y/y.
Market watch
All rates cited below exclude fuel surcharges unless otherwise noted.
According to the National Weather Service (NWS), Downtown Los Angeles experienced its third-largest rainfall in history last week, receiving 7.03 inches, or 49% of its typical yearly total, in just two days. The broader Los Angeles freight market received over a foot of rain in just five days, with some locations recording up to 14.88 inches. As a result, last week, the volume of outbound truckloads moving and load posts decreased by 5% and 9%, respectively. Los Angeles outbound linehaul rates also decreased, down 2% to an average of $1.64/mile.
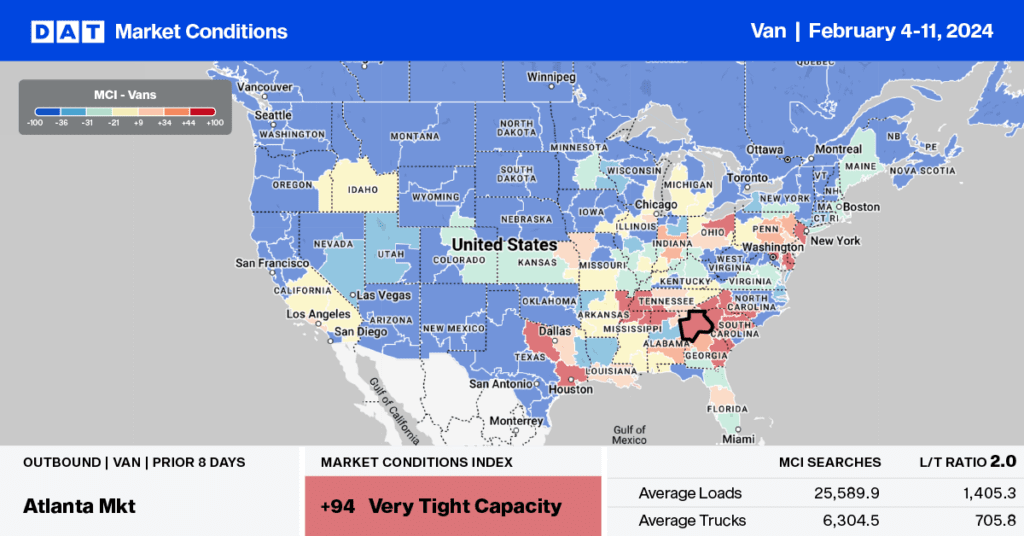
The surge in imports in January has resulted in higher truckload volumes in port markets, including Savannah, following last month’s 9% m/m increase in containerized imports. The volume of loads moved increased by 4% w/w and is now 5% higher than last year. However, with ample available capacity in the market, linehaul rates continue to fall, down 8% w/w and 13% y/y. At $1.67/mile, outbound Georgia rates are identical to 2019, while on the short-haul lane between Savannah and Atlanta, carriers were paid an average of $2.21/mile last week, around $0.17/mile lower than last year.
Load-to-Truck Ratio (LTR)
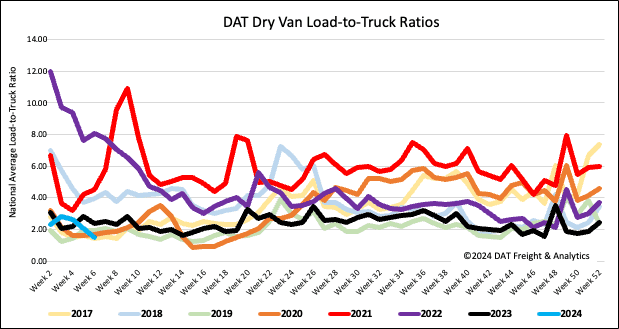
National spot market load post (LP) volumes plunged last week to start the first shipping week of February. Following last week’s 27% week-over-week (w/w) drop, LP volumes decreased to the lowest in eight years. Carrier equipment posts (EP) were up by 2%, resulting in last week’s dry van load-to-truck ratio (LTR) dropping by almost 30% to 1.49, the lowest since 2017.
Linehaul spot rates
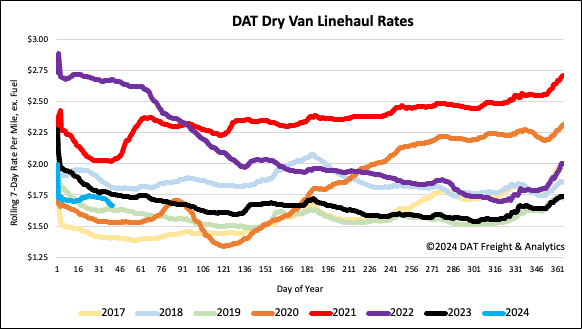
The national average dry van linehaul rate dropped by $0.05/mile last week, the largest week-over-week (w/w) decline in a year. At $1.67/mile, linehaul rates are $0.09/mile lower than last year and just $0.03/mile higher than 2019. Based on the volume of loads moved DAT’s Top 50 lanes averaged $1.94/mile last week, $0.27/mile higher than the national average.