The dramatic spike in diesel prices caught most carriers by surprise, and even though rates are at record levels, profits margins are eroding rapidly. In recent weeks, the historic jump in fuel prices is the largest we’ve seen since the EIA started tracking the weekly national average ULSD price. Even during the Great Recession, diesel didn’t go as high as now.
For a small fleet owner in the long-haul sector, fuel is now around 45% of operating costs compared to just 33% in November 2020 as the economy was in the process of reopening. Record-high fuel prices have captured most of the headlines recently, but it’s fuel as a percentage of revenue that carriers need to watch.
Too many long-haul operators focus on either the rate per mile or the cents per gallon at the pump, but it’s the relationship between the two that impacts gross profit margin the most. Right now, that number is in dangerous territory for those carriers locked into fixed rates or unable to get total cost recovery of the fuel surcharge or higher pump prices.
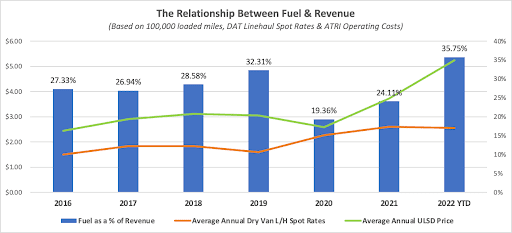
As of last week, fuel as a percentage of revenue was almost 36% based on a national average linehaul rate of $2.43/mile, diesel at $5.13/gal this week, and a financed truck running 110,000 miles/year. In November 2020, when diesel was just $2.45/gal, fuel was just 19% of revenue and partly explained why 2021 was such a profitable year for carriers.
For context on why this number is a warning sign, the industry experienced record high bankruptcies in the second quarter of 2019 when fuel as a percentage of revenue was 32%, below where it is now. It’s time to slow down, cut out unnecessary idling, eliminate deadhead miles, and aim to get average fuel costs closer to 25% of trip revenue – the long-term target for sustained profitability.
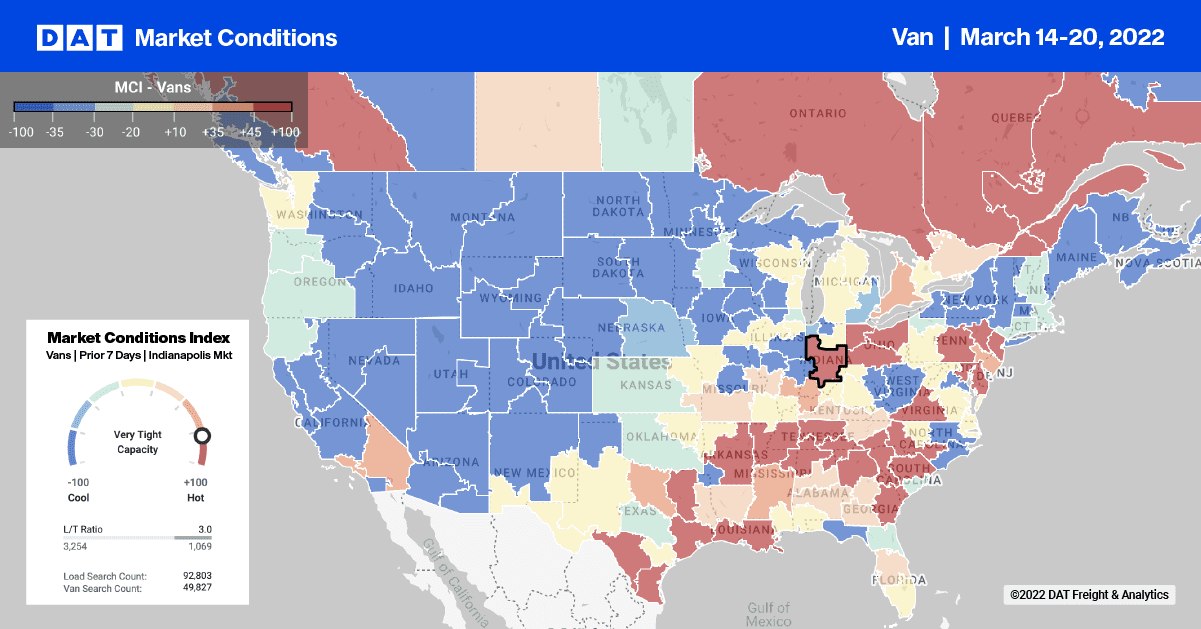
Load post volumes jumped 32% w/w in Los Angeles last week as import volumes begin to climb again following the Lunar New Year break in Asia in February. Outbound truckload volumes on the West Coast track closely with inbound loaded container volumes. Still, in a reversal of last year’s tight capacity, spot rates continue to drop following last week’s $0.14/mile decrease in Los Angeles outbound rates. On the high-volume Los Angeles to Chicago lane, rates are now $0.26/mile lower y/y at $2.17/mile excl. FSC after dropping $0.84/mile since the start of the year. In the Southeast market of Albuquerque, capacity tightened, pushing up rates by $0.08/mile to an average of $1.67/mile excl. FSC.
In the large e-commerce warehouse markets in the Northeast, capacity loosened rapidly last week, especially in Harrisburg and Allentown, where spot rates dropped by $0.19/mile and $0.13/mile, respectively. The story was much the same in Chicago, where spot rates have dropped by $0.39/mile since March to an outbound average of $3.04/mile excl. FSC last week. In Elizabeth, NJ, rates dropped $0.14 last week to $2.34/mile excl. FSC, which is about the same amount that spot rates decreased overall in the top five freight markets last week.
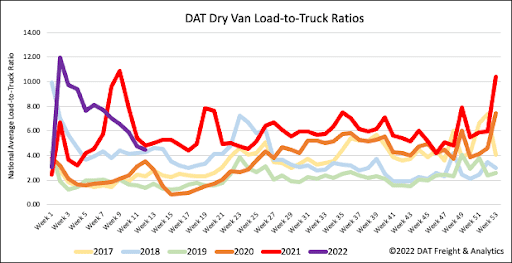
After the fifth week of declining dry van load post and increasing equipment post volumes, last week’s dry van load-to-truck (LTR) dropped below 2021 for the first time this year. Load post volumes are 1% higher than last year’s same week. Last week’s dry van LTR is now 8% lower y/y after decreasing 5% w/w from 4.71 to 4.44.
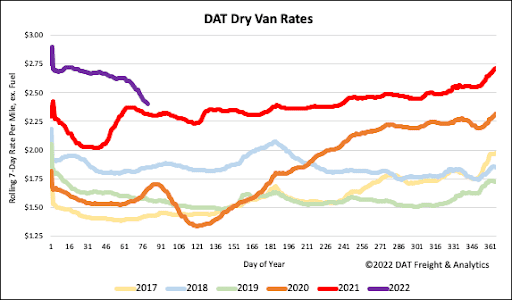
Dry van spot rates plunged by $0.13/mile last week despite record-high retail diesel prices. That surpasses even the most significant w/w decrease recorded when demand crashed at the start of the pandemic. Dry van spot rates are now down $0.25/mile in the last month ending last week at $2.43/mile excl. FSC. Compared to previous years, spot rates are just $0.09/mile higher than the previous year but $0.55/mile higher than the same week in 2018.


