As the retail shopping season nears the finish line, December import volumes confirm a non-existent peak season in the retail sector. According to IHS Markit, TEU, (twenty-foot equivalent unit) import volumes were down 1% m/m and 12% y/y in December, and unlike prior years, import volumes are slowing rapidly. Since the peak in imports in May this year (which recently resulted in overstocked warehouses), total TEU volumes have dropped 25%. Imports from Northern Asia have dropped by 28% from their peak volumes in August, with the last quarter of 2022 closely following 2019 volumes.
With most holiday merchandise already on retailers’ shelves or in their warehouses, December truckload volumes are starting to flatten out with best estimations of a flat to slightly up year-end projection. NRF Vice President for Supply Chain and Customs Policy Jonathan Gold said, “Retailers are in the middle of the annual holiday frenzy, but ports are headed into their winter lull after one of the busiest and most challenging years we’ve ever seen.”
On the West Coast, the International Longshore and Warehouse Union members have been working without a contract since their previous agreement with the Pacific Maritime Association expired on July 1. Worries about potential West Coast disruption led many retailers to bring in cargo early this spring, resulting in a shift to East Coast and Gulf Coast ports. December imports on the West Coast were down 10% y/y, 13% y/y on the East Coast, and 8% y/y along the Gulf Coast. However, full-year results show that Gulf Coast had a 14% increase in imports compared to last year. Highlighting the coastal shifts this year, the East Coast and West Coast volumes switched places, with the East Coast up 4.5% over 2021 and the West Coast down 5% over 2021.
Market Watch
All rates cited below exclude fuel surcharges unless otherwise noted.
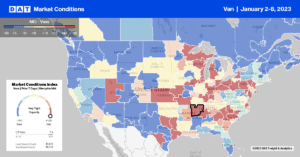
Dry van spot rates in California decreased by $0.11/mile last week. At the same time, in Northern California, hardest hit by the ongoing series of atmospheric river events this week, load posts surged in Stockton. Outbound volumes were up by 26% w/w in this large warehouse market. On high-volume lanes, including Portland to the north, spot rates increased by almost $0.20/mile to an average of $2.72/mile last week. That’s still $1.65/mile lower than the previous year, with a similar trend reported on the 800-mile Stockton to Seattle lane, where rates averaged $2.47/mile last week, $1.85/mile lower y/y.
While not a large outbound spot market, capacity tightened considerably in Medford, OR, where spot rates for outbound loads increased by $0.13/mile to $1.76/mile following a 62% w/w increase in load posts. In Houston, load posts jumped by 33% w/w, resulting in a slight tightening of available capacity – outbound spot rates were up a penny per mile to $1.86/mile. On the 2,200-mile lane to Spokane, WA, spot rates jumped to $2.29/mile last week following nine weeks of gains, although, at this level, rates are still around $0.35/mile lower than the previous year.
In Elizabeth, NJ, load posts were up for the third week, increasing by 15% w/w with a negligible impact on capacity – outbound average spot rates decreased slightly to $1.83/mile. Loads west to Chicago were up $0.05/mile to $1.40/mile or around $0.60/mile lower than the previous year. In Chicago and Joliet markets, volumes were up by 16% w/w, with spot rates down by $0.02/mile to $2.58/mile for outbound loads. On the 700-mile lane from Chicago to Atlanta, spot rates have increased by almost $0.60/mile over the last six months to an average of $2.59/mile.
Load-to-Truck Ratio (LTR)
Even though last week was another short work week for shippers and brokers, load posts came in at just over one million loads, almost identical to where the dry van market started in 2018. Last week was the first time load posts exceeded one million since the volume surge in the week after Thanksgiving. Carrier equipment posts remained at the highest level in six years. As a result, last week’s dry van load-to-truck ratio (LTR) increased and remained unchanged at 5.56.
Linehaul Spot Rates
The national average dry van rate started in 2023 at 27% or $0.73/mile lower than last year. At $1.97/mile, dry van linehaul rates are around $0.30/mile higher than in 2020 before the pandemic and $0.27/mile higher than in the prior five pre-pandemic years for the first shipping week of the calendar year. The national average linehaul rate of $1.97/mile was $0.30/mile lower than the top 50 dry van lanes based on the volume of loads moved, which averaged $2.27/mile last week.


