As they typically do each February, U.S. containerized import volumes dropped following the multi-week closure of factories during Chinese New Year celebrations. Imports dropped 7% month-over-month (m/m) but were historically high compared to prior years. Most notably, imports are up by 4% or just over 84,000 containers compared to 2020, right before the World Health Organization declared the global pandemic. Compared to the month of February back to 2015, last month’s total was 18% higher.
According to IHS Markit/PIERS, TEU (twenty-foot equivalent unit) volumes totaled 2.17m, with volumes on the West Coast dropping by 11% m/m compared to 4% on the East Coast. Gulf Coast imports increased by 2% m/m, driven by the Port of Houston, where imports increased by 3% m/m. The Port of Los Angeles held the number one spot, recording a 6% m/m decrease, while next door at the Port of Long Beach, volumes plunged by 18%. In the number two port in New York, volumes dropped by 8% m/m. Nationally, imports from China fell by 12% in February, accounting for almost half of all containers imported last month.
Find dry van loads and trucks on North America’s largest on-demand freight network.
All rates cited below exclude fuel surcharges unless otherwise noted.
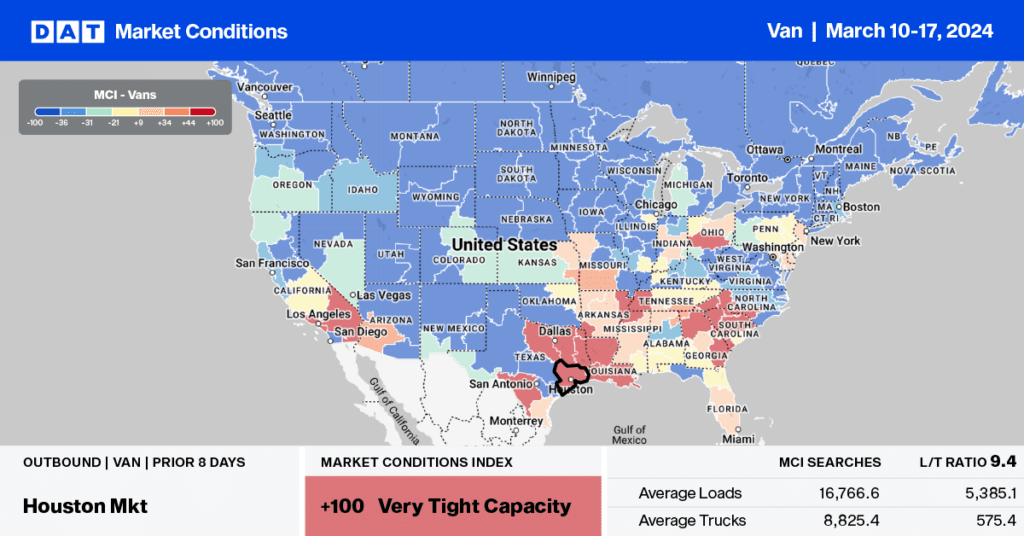
In the major freight distribution market in the Southeast, available capacity tightened slightly in Atlanta following last week’s $0.01/mile increase. After dropping for the prior three weeks, outbound loads paid carriers an average of $1.51/mile last week on a 12% higher volume of loads moved. Outbound volumes are just over 3% higher than last year and by the same amount on the high-volume lane south to Lakeland, FL, where carriers were paid an average of $2.50/mile.
On the West Coast in Los Angeles, available capacity continues to tighten for the fourth week following last week’s $0.02/mile increase to an average outbound rate of $1.61/mile. The volume of outbound loads moved increased by 6% last week but remains 15% lower than last year.
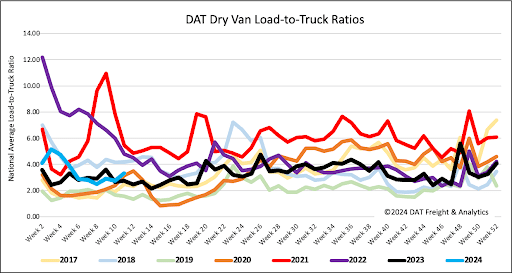
Dry van load post volume increased by 7% last week and 4% month-over-month (m/m) but trailed last year by 3%. Available capacity decreased following last week’s 12% drop in equipment posts, increasing the load-to-truck ratio by 21% to 3.32.
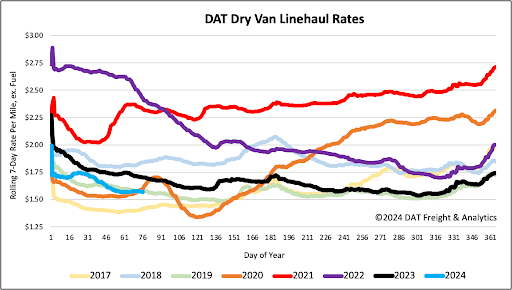
Dry van linehaul rates were flat again last week, making it three weeks in succession, as the volume of loads moved continues to increase, up 10% last week and 7% in the last month. At $1.58/mile, dry van linehaul rates are $0.14/mile lower than last year. Based on the volume of loads moved, DAT’s Top 50 lanes averaged $1.86/mile last week, which is $0.28/mile above the national average.


