The $0.71/gal surge in diesel prices since July 4 has devastated small carriers operating in the spot market, especially those lacking access to a fuel surcharge recapture program. Never has there been a more critical time to understand operating costs – diesel has increased to 37% of total costs or $0.69/mile. More carriers elected to leave the long-haul interstate sector in August, according to data from the FMCSA, which captures entry and exit data of carrier authorities. In July, the industry recorded approximately 10,700 carrier exits; in August, there were just over 11,700, an increase of more than 1,000 carriers.
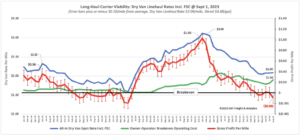
Operating costs for small carriers have also gone up, rising by an estimated $0.11/mile in the last two months. However, at the end of August, average operating costs for a long-haul interstate carrier were $1.90/mile compared to $2.04/mile a year ago. Operational costs are based on dry van rates, including the fuel surcharge at $2.09/mile, diesel at a national average of $4.49/gal, and driver wages at $60,000/year. 2019 was a difficult year for the trucking industry, especially small carriers, and based on current market dynamics, spot market carriers are starting to operate well into the red as they did in 2019. It was also a year characterized by a non-existent peak season, softening spot rates, and an oversupplied market (much the same as the 2023 freight market).
Market Watch
All rates cited below exclude fuel surcharges unless otherwise noted.
Dry van capacity tightened slightly in DAT’s top five freight markets last week, pushing up spot rates for the third week to an average of $1.70/mile following last week’s $0.01/mile gain. In Ontario on the West Coast, spot rates were flat at $1.82/mile, while next door in Los Angeles, outbound linehaul rates dropped another $0.03/mile to $1.71/mile. The volume of loads moved on the number one outbound lane between Los Angeles and Stockton was down 6% week-over-week (w/w) and 14% month-over-month (m/m), consistent with declining import volumes.
After peaking at around $3.40/mile at the end of 2021 when imports from overseas were pouring into the U.S., linehaul rates on the Los Angeles to Chicago lane have dropped a whopping $2.05/mile – or 60% – since then, averaging just $1.35/mile last week. Outbound spot rates in Atlanta continue to increase in the Southeast, averaging $1.59/mile last week, up $0.03/mile. Linehaul rates in the Dallas/Fort Worth Metroplex and Chicago were up by a similar amount, averaging $1.41/mile and $2.06/mile, respectively, last week.
Load-to-Truck Ratio (LTR)
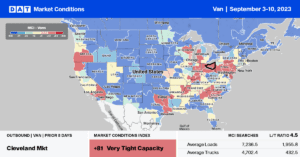
Dry van spot market load posts (LP) were predictably down last week following the long Labor Day weekend. LP volumes decreased 7% w/w, although they were around 35% lower than last year and 6% higher than in 2019. Carrier equipment posts decreased by 18% w/w, resulting in last week’s dry van load-to-truck ratio (LTR) increasing by 14% w/w from 3.02 to 3.31.
Linehaul Spot Rates
Dry van spot rates were flat last week, going against the typical post-Labor Day trend in which spot rates decrease (they dropped $0.03/mile this time last year). At $1.62/mile, the national average was $0.26/mile lower than in 2022 and only $0.02/mile higher than in 2019.