Since last October, the truckload sector has seen more carriers leave the industry than join. Since 2014 DAT Freight & Analytics has been tracking the spread between carriers obtaining new authorities or reactivating existing ones (green bars in the chart below) and those exiting the industry (red bars). The spread or difference between the two (black line) gives us a sense of the sentiment of the interstate carrier (i.e., will I get back into the industry, start a new business, or will I get out?).
The spread has a very high positive correlation (r=0.92) with new and reactivated authorities and dry van linehaul rates, making it another data point to consider when considering the bottom of the spot market. To be clear, this isn’t the total number of carriers in the for-hire sector each month, just the change in carrier status, which reflects changes in capacity levels mainly in the long-haul spot market.
Since 2014 in the interstate long-haul sector, the industry added around 1,000 net new carriers per month — that was up until PPP loans ended around June 2020, spot rates increased, and diesel prices plunged. The combination of these factors during the second half of 2020 was the catalyst for the resulting 18-month surge in new carriers and a record period of profitability, the most profitable since deregulation, according to many industry experts. In the 12 months from May ’20 to May ’21, the interstate sector added 51,000 net new carriers, triggering a surge of new companies that lasted through 2021. In the 29 months from when the pandemic surge started around May ’20 to when we started losing long-haul capacity last October, 287,000 new carriers joined the for-hire sector, and 161,000 exited the market, leaving an unprecedented gain of 125,000 carriers.
Since October last year, just over 15,500 interstate carriers have left the industry as the market readjusts supply to tepid demand levels. The latest numbers for May showed the second-highest number of carriers left the sector surpassed only by January this year. As spot rates bottom out and show signs of increasing, we’re left to wonder if the bleeding has stopped and the sentiment is improving; one thing is sure, though, when the market turns positive later this year, shippers will have far fewer carriers at their disposal.
Market Watch
All rates cited below exclude fuel surcharges unless otherwise noted.
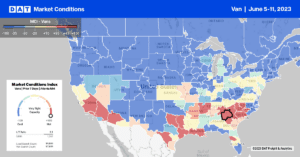
Linehaul rates in the Top 5 spot market states, California, Texas, Georgie, Illinois, and New Jersey, were flat last week at $1.88/mile. Compared to prior years, the 5-state average is $0.39/mile lower than the previous year but around $0.22/mile higher than in 2019. Outbound California dry van rates increased by $0.02/mile w/w to an average of $2.08/mile, with similar sequential gains in Texas at $1.69/mile. Outbound Georgia rates were flat at $1.98/mile, while rates dropped by $0.02/mile in Illinois to $1.98/mile. New Jersey outbound average rates settled by the same amount to $1.40/mile, just $0.08/mile higher than in 2019.
Los Angeles linehaul rates averaged $1.85/mile last week, up $0.01/mile, while outbound loads in Ontario were flat at $1.97/mile. Los Angeles to Phoenix loads paid $2.94/mile, the highest since last December and up by almost $0.30/mile since March. Los Angeles to Stockton loads at $2.82/mile was the highest since last September and just $0.60/mile lower than the previous year. On the southern border in El Paso, spot rates were up for the fourth week, increasing by $0.06/mile to $1.59/mile. El Paso to Houston loads at $1.66/mile was the highest in 12 months and almost $0.30/mile higher than the long-term average.
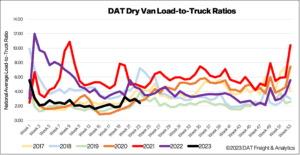
Load-to-Truck Ratio (LTR)
Dry van spot market volumes dropped back to April levels erasing all of the gains in May following last week’s 2% w/w decrease. Load posts are still 35% lower than they were a year ago and are 23% lower than in 2019. Carrier equipment posts surged by 21% w/w, resulting in the dry van load-to-truck ratio (LTR) falling by 18% w/w from 2.97 to 2.41.
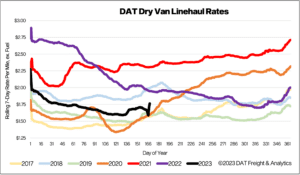
Linehaul Spot Rates
After three weeks of inching higher, dry van linehaul spot rates dropped back almost $0.03/mile last week to a national average of $1.69/mile. Spot rates are still $0.07/mile higher than the prior month and $0.31/mile lower than the previous year. Based on the volume of loads moved, the average rate for the top 50 dry van lanes was $0.31/mile higher at $2.00/mile last week, decreasing by $0.02/mile from the week prior.