According to ISH Markit/PIERS data, January containerized import volumes were 5% higher than in December, growing fastest in seven years. The total TEU (twenty-foot equivalent units) volume reached 2.284 million units, 8.7% higher than last year and the highest since 2018, except for the pandemic-impacted years of 2020 and 2021. West Coast TEU volume continues to grow, up 18.2% year-over-year (y/y), while East Coast volumes were only up 1.2% y/y. Volumes through the Port of Los Angeles, the largest port in the U.S., grew by 23% month-over-month (m/m) in January compared to the number two port in New York, where volumes were up by 2.1% m/m.
Get the clearest, most accurate view of the truckload marketplace with data from DAT iQ.
Tune into DAT iQ Live, live on YouTube or LinkedIn, 10am ET every Tuesday.
On last week’s DAT Freight & Analytics show, intermodal and drayage expert Paul Brashier, Vice President of Drayage and Intermodal at ITS Logistics, expected the impact on drayage capacity resulting from the shift in volume back to West Coast ports will be significant. On top of Electric Vehicle (E.V.) mandates in California, which are expected to reduce drayage capacity and higher import volumes in 2024 due to potential East Coast labor disruptions, “shippers are heading to the West to reduce being exposed to supply chain disruptions again.” Brashier noted, “About 25% of the freight that used to go to the U.S. East Coast via the Suez Canal will go into West Coast ports as that waterway is essentially closed down to ocean traffic due to the Red Sea shipping attacks”.
Market watch
All rates cited below exclude fuel surcharges unless otherwise noted.
At $1.72/mile, the average linehaul rate in the Top 5 spot market states (CA, GA, IL, NJ, and TX) is identical to this time in 2019 following last week’s $0.04/mile decrease. Illinois recorded the largest weekly decrease, dropping by $0.10/mile to $2.12/mile last week, $0.05/mile lower than 2019. California outbound spot rates have dropped for six weeks, averaging $1.84/mile last week, while in Atlanta, linehaul rates averaged $1.64/mile, dropping for the third week.
Even though the volume of truckloads moved from the Chicago market, the largest in Illinois, is 7% higher than last year, an oversupply of truckload capacity has pushed spot rates down by 5% over the same timeframe. Chicago outbound spot rates have dropped for four weeks, averaging $1.91/mile, following last week’s $0.01/mile decline. On the high-volume regional lane to Columbus, OH, Chicago carriers were paid an average of $2.35/mile last week, just over $0.20/mile lower than last year. At $2.06/mile, loads west to Minneapolis averaged $2.06/mile, which is also close to $0.20/mile lower than last year.
Load-to-Truck Ratio (LTR)
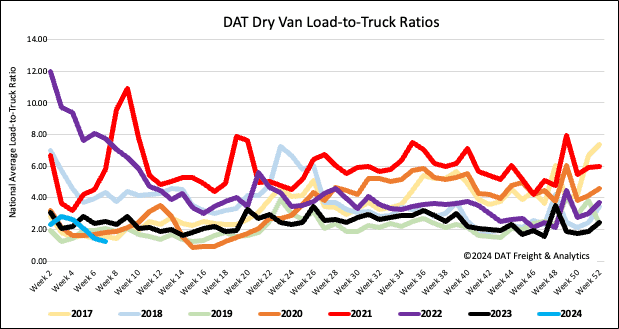
National spot market load post (LP) volumes dropped for the fourth consecutive week following last week’s 21% week-over-week (w/w) decline. LP volumes have remained at their lowest in eight years and 61% lower than last year. Carrier equipment posts (EP) decreased by 6%, resulting in last week’s dry van load-to-truck ratio (LTR) dropping by 16% to 1.21, the lowest since 2017.
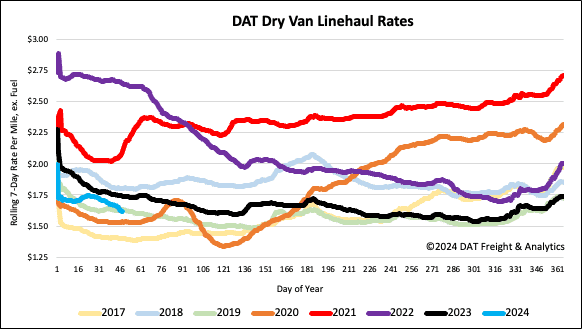
Linehaul spot rates
Following the mid-January national freeze, the average dry van linehaul rate dropped by $0.12/mile, following last week’s $0.04/mile decrease. At $1.63/mile, linehaul rates are $0.13/mile lower than last year and $0.01/mile lower than 2019. Based on the volume of loads moved DAT’s Top 50 lanes averaged $1.88/mile last week, $0.25/mile higher than the national average.