US export volumes have been on a downward trend since 2020 and are not showing any signs of a course change. According to the latest data from PIERS, total export volume for June was down 8.7% m/m and 1.3% y/y, and YTD export volume is down 8.7% y/y. The top 3 export volumes come from wood pulp paper, mineral, and vegetable products; all three have declined nearly 10% YTD.
Approximately 53% of export volumes are on the East Coast, with paper and mineral products as the top two highest export volumes for the east coast, with about 27% of the exported TEUs. Export volume was down 7.5% m/m on the east coast and YTD down 9.1% y/y. The biggest YTD driver of the East Coast decline was wood pulp and paper products to China, which is down nearly 80,000 TEUs, as China has banned imports of US scrap paper and other recyclable materials. Paper exports to China have steadily declined since China enacted the Green Fence policy in 2017.
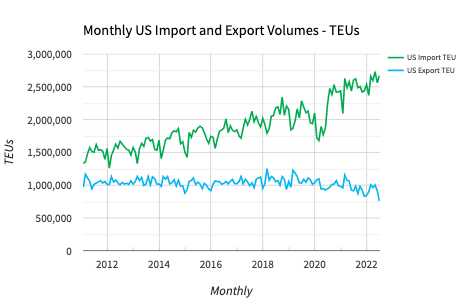
The West Coast is the second largest export region and accounts for 32% of the total export volume. Vegetable products are the number one export by volume and account for approximately 25% of the west coast export volumes. Paper product is number two, and foodstuff is third for the west coast, and together they account for 29% of the export TEUs. Export volume was down 10.2% m/m on the west coast and YTD down 11.9% y/y.
The biggest driver of the YTD declines has been in the vegetable products and foodstuff; together, they are down about 93,000 Teus. Exports out of Oakland had encountered supply chain hurdles early this year; shipping companies prioritized getting empty containers back to Asia due to the record-breaking spot rates and did not stop in Oakland to pick up exports. As a result, $25 billion has been lost in agricultural exports in the past six months due to issues exporting from the US, said Zippy Duvall, president of the American Farm Bureau.
All rates cited below exclude fuel surcharges unless otherwise noted.
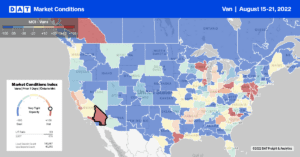
Inbound load volumes to the West Coast have been steadily declining over the past four weeks, down 12% m/m. In Oakland in the San Francisco freight market, inbound volumes have decreased 8% in the last month and 7% in Los Angeles over the same timeframe. Outbound volumes have also decreased in both markets, down 12% m/m in San Francisco and 16% m/m in Los Angeles. Spot rates from Los Angeles to Stockton, a high-volume lane for Asian retail imports, were at their lowest level in 12 months at $3.13/mile last week, while loads east to the large Phoenix warehouse market followed the same trend at $3.18/mile.
On the high-volume intermodal lane between Los Angeles and Chicago, spot rates continue to increase and, at $1.91/mile this week, are now $0.20/mile higher than the July average but still $0.88/mile lower y/y. In the Midwest, spot rates between Chicago and Atlanta continue to climb, averaging $2.27/mile last week, representing an increase of $0.27/mile since June.
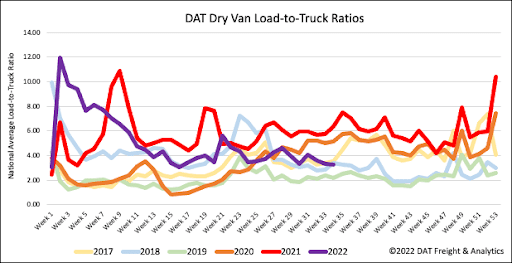
Load posts were down slightly last week, decreasing by 2%, while available capacity increased following last week’s 2% w/w increase in equipment posts. Load posts are 41% lower y/y, and this is the first month since May 2020 where load posts have consistently been below one million weekly posts. As a result of slightly lower load posts and higher equipment posts last week, the dry van load-to-truck (LTR) remained relatively flat at 3.28.
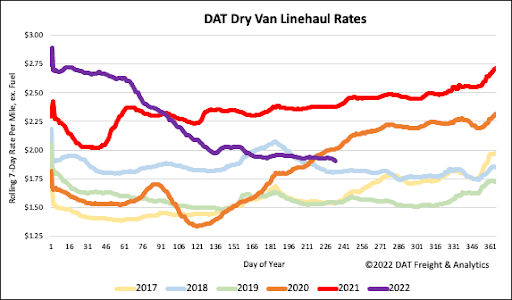
Dry van linehaul rates have decreased over 30% since the start of the year, following last week’s $0.02/mile decrease. The national average dry van linehaul rate ended last week at $1.93/mile, which is $0.48/mile lower y/y. Compared to the average of the top 50 lanes at $2.31/mile this week, the national average was $0.38/mile lower last week. Dry van linehaul rates are still $0.32/mile higher than the average of pre-pandemic years.


