The pandemic has changed many things in trucking, as has what’s known as the “Amazon Effect”, where new distribution centers and warehouses are popping up at an alarming rate. They’re also much closer to urban populations to facilitate next or same-day deliveries.
Along the way, DAT’s truckload carrier network has seen an increase in the average length of haul. DAT looked at the number of miles between pickup and delivery by week from the beginning of 2020, right before the COVID pandemic took hold right through to the end of February.
In the reefer sector, the average haul length had increased by 18% or 102 miles over that timeframe to an average trip length of 610 miles. In the dry van sector, the average length of haul was much lower at 439 miles, although the increase in trip length was less than the reefer sector at 14%. In flatbed, there was not much change in the last two years, with the average trip staying around 330 miles.
“Long-term, the trend is likely being driven by shifting warehouse and transportation networks,” according to Ken Adamo, DAT Chief of Analytics. “Short term, it’s more attributable to inefficiency. You have rail issues, fixed networks in shambles, and a litany of other reasons why truckers are hauling longer. Heck, we saw examples of dray moves from Baltimore to Buffalo.”
After a year of tight capacity and escalating spot rates, capacity on the West Coast continues to loosen. Truckload volumes have been tied closely to import volumes in the Ports of Los Angeles and Long Beach, a consistent top five truckload freight market and number one destination for imports from Asia. Both terminals are catching their breath during a seasonal lull in imports when factories in Asia slow or stop production during the Lunar New Year at the start of February. Dry van spot rates have been dropping consistently since then and have fallen by $0.30/mile to an average of $2.64/mile excl. FSC this week. Load post volumes have decreased by 24% over the same timeframe.
On the high-volume freight lane between Los Angeles and Chicago, where an estimated 30% of intermodal volume moves, truckload spot rates have plunged to almost their lowest level in 12 months. Rates on this long-haul lane averaged $2.08/mile excl. FSC last week and had dropped by $1.20/mile since December’s peak when import volumes were surging ahead of last year’s retail shopping season. While the backlog of container ships had dropped to 50 as of last Friday — down from the Jan. 9 peak of 109 — market analysts expect import volumes to surge again, causing the buildup of vessels to increase again.
According to a Journal of Commerce (JOC) report, regional warehouses are already full. With marine terminals still at peak capacity, truckload carriers can expect freight volumes to return to West Coast markets in April. According to the Port of Long Beach digital platform known as the WAVE, container import volumes are projected to increase by 34% w/w to 109,507 TEU next week. The Port of Los Angeles Signal platform projects that loaded imports will increase by the same amount to 153,379 TEU next week (up 17% y/y).
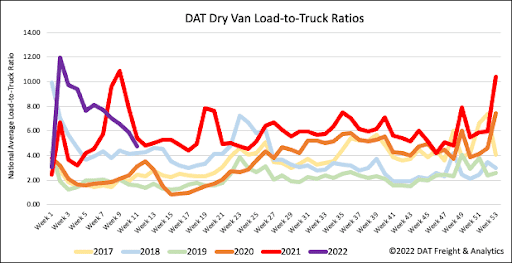
Dry van load post volumes have dropped by 30% in the last month as the freight markets cool. Load posts dropped 13% last week, and capacity loosened as more carriers posted their equipment for loads for the fourth week in a row. The net effect of lower volumes and more equipment posts resulted in the dry van load-to-truck (LTR) ratio dropping for the fifth week in a row from 5.88 to 4.71.
Capacity in the truckload spot market continues to loosen as contract rates increase, shifting freight volumes away from the spot market. Contract rates are now on average $0.10/mile higher than spot rates, which is the first time spot has been lower than contract since December last year.
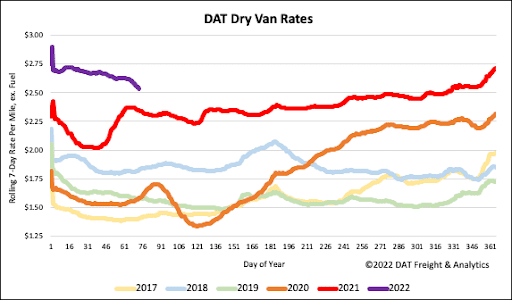
Talks of the so-called driver shortage also seem to have disappeared as trucks begin to cycle through networks faster, increasing capacity in the process. Dry van spot rates have been declining for eight weeks in a row following last week’s $0.09/mile decrease in linehaul rates. The dry van national average ended the week at $2.55/mile excl. FSC is still $0.28/mile higher than the previous year.