The outlook for freight volumes remains challenging, as the Truckload Ton-Mile Index, updated through August 2025 with revised industrial production data, shows demand volumes retreating to mid-2019 levels. August saw a disappointing 0.7% month-over-month seasonally adjusted decline from July, confirming that freight volumes are trending downwards after reaching a tepid peak earlier in the year. This weakness is not isolated; major sectors such as paper production, plastics manufacturing, machinery, and chemicals (excluding pharmaceuticals) all registered seasonally adjusted declines. Furthermore, the Federal Reserve Board’s annual revisions confirmed that manufacturing activity in 2022 was significantly weaker than initially estimated, underscoring that the current soft demand environment is a deep, structural contraction within the freight economy.
Get the clearest, most accurate view of the truckload marketplace with data from DAT iQ.
Tune into DAT iQ Live, live on YouTube or LinkedIn, 10am ET every Tuesday.
The implication for truckload carriers is clear: the current soft market conditions are entrenched. With the Ton-Mile Index reflecting weak freight demand, the industry cannot expect pricing dynamics to shift in carriers’ favor anytime soon. Although niche construction steel production continues to show strength, the broad, systemic weakness in manufacturing suggests robust growth in freight volumes is not foreseeable until late Q2 2026 at the absolute earliest. Consequently, pricing power will remain squarely with the shippers through the upcoming bid cycle, leaving carriers reliant on extreme cost discipline to maintain profitability amidst severely constrained demand.
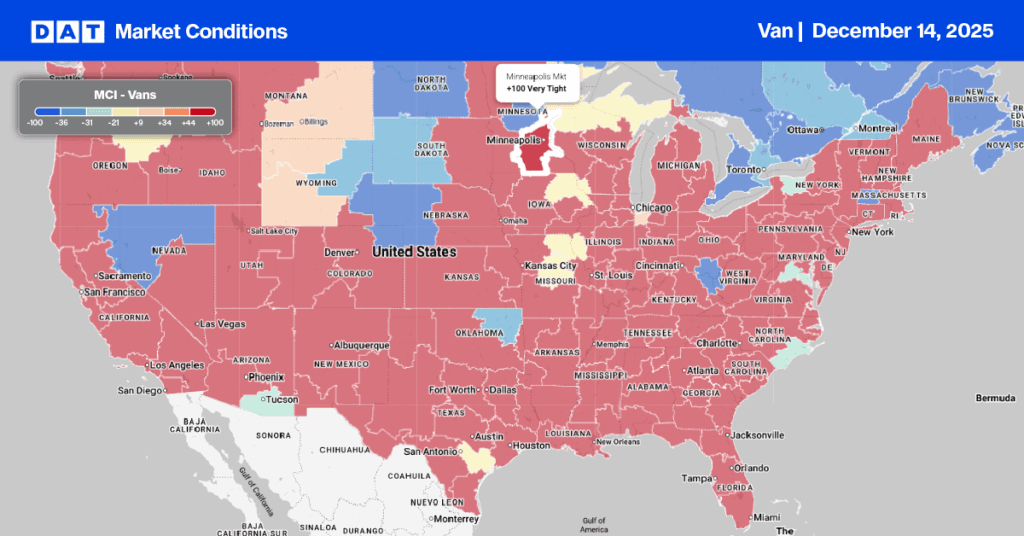
Dry Van Market Conditions Index
Despite a 9% decrease in dry van load post volumes nationally last week, which pushed the load-to-truck ratio down 13% week-over-week to 8.63, Minneapolis stood out with an 8% increase in load post volumes. This occurred even as the city was severely impacted by an “Arctic Plunge” that brought wind-chill temperatures down to minus -30 last weekend. As a result of this increased demand, outbound Minneapolis dry van rates climbed by $0.14, reaching $2.06 per mile.
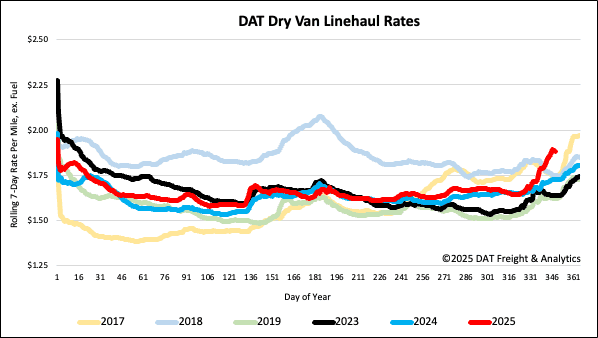
National dry van linehaul spot rates
Spot dry van linehaul rates jumped by another $0.08 per mile last week, settling at an average of $1.89 per mile. This rate is $0.16 or 9% higher than the same week last year.
The average rate for DAT’s top 50 lanes by load volume increased by $0.07 per mile last week, averaging $2.20 per mile and $0.31 higher than the national 7-day rolling average spot rate.
In the 13 key Midwest states, which represent 45% of national load volume and often indicate future national trends, spot rates increased by $0.09 per mile to $2.19 per mile, which was $0.30 above the national 7-day rolling average.