The Logistics Manager’s Index recorded 52.9 in April 2024, down (-5.4) from March’s reading of 58.3, the highest growth rate in 18 months. This breaks four consecutive months of increasing expansion rates and is the slowest rate of growth observed so far in 2024. The slowed pace of growth is driven by a significant decrease in the expansion of Inventory Levels (down 12.8 points to 51.0, which is the most marginal level of expansion).
Get the clearest, most accurate view of the truckload marketplace with data from DAT iQ.
Tune into DAT iQ Live, live on YouTube or LinkedIn, 10am ET every Tuesday.
According to Zac Rogers at Colorado State University, “The Inventory Level index read in at 51.0, down significantly from March’s reading of 63.8. The slowdown in inventory growth, particularly in the first half of the month, is the primary reason the overall index slowed down in April. This decrease in Inventory Levels, a crucial component of the LMI, has profoundly impacted the industry’s growth. That being said, we still read growth for the fourth consecutive period, a shift from the end of 2023, where Inventory Levels contracted in 7 out of 8 months. Inventory Levels are 0.1 points higher than a year ago and 21.3 points lower than two years ago.
The LMI score combines eight unique components of the logistics industry, including inventory levels and costs, warehousing capacity, utilization, and prices, and transportation capacity, utilization, and prices. The LMI is calculated using a diffusion index, in which any reading above 50.0 indicates that logistics is expanding; a reading below 50.0 indicates a shrinking logistics industry. The latest LMI results summarize the responses of supply chain professionals collected in April 2024.
Market watch
All rates cited below exclude fuel surcharges unless otherwise noted.
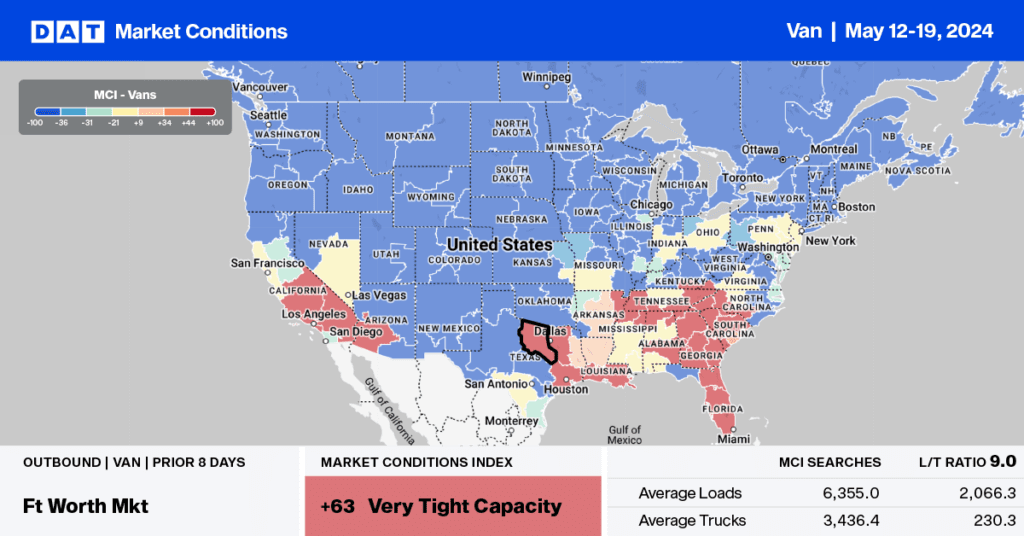
Dry van capacity tightened rapidly last week on the West Coast, especially in California, Nevada, and Arizona, where Roadcheck Week inspectors camp put on Interstates 80, 15, and 40. Those carriers that stayed out last week faced lengthy delays, resulting in a tightening of capacity and a $0.08/mile w/w increase in the three-state average of $1.94/mile.
Carriers were paid an average of $1.50/mile for loads outbound Florida, up $0.32/mile last week. Most gains were reported in the larger Lakeland market, where linehaul rates increased by $0.27/mile w/w to $1.38/mile. Atlanta linehaul rates increased by $0.10/mile to $1.68/mile last week, while Chicago spot rates reversed the three-week slide, increasing by $0.05/mile to $1.68/mile.
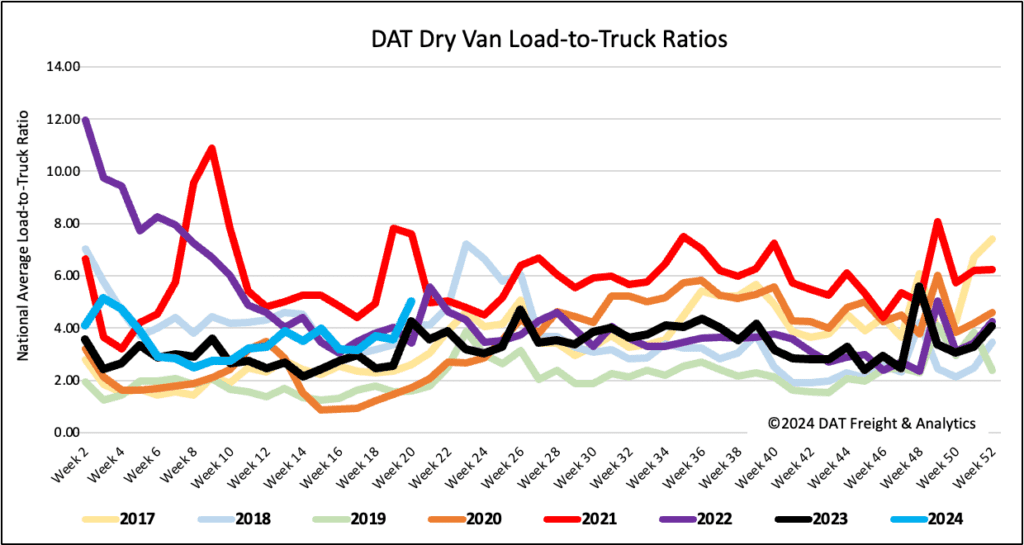
Load-to-Truck Ratio
Last week’s International Roadcheck Week sent many carriers to the sidelines, as they typically do whenever the focus is on braking systems and controlled substances. Dry van load post volume spiked by 30% last week, compared to the 45% w/w increase last year during Week 20. Carrier equipment posts dropped 8% w/w compared to the 12% w/w decrease last year, resulting in the dry van load-to-truck ratio up by 40% to 5.01.
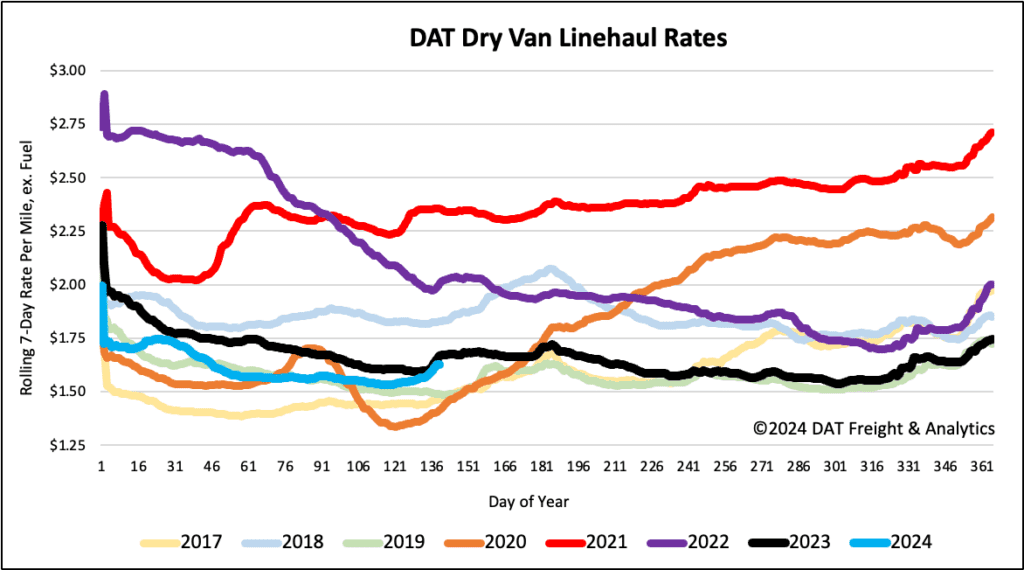
Linehaul spot rates
The national average dry van linehaul rate surged last week, increasing by $0.06/mile to a national average of $1.63/mile. Compared to last year, linehaul rates are $0.04/mile lower on a 6% higher volume of loads moved. DAT’s Top 50 lanes, based on the volume of loads moved, averaged $1.95/mile last week, up $0.08/mile w/w and $0.32/mile higher than the national average.