The September Logistics Managers’ Index (LMI) came in at 52.4, up 1.2 from August. This is the second consecutive month of expansion following three straight contraction readings from May-July. While this is the fastest expansion rate since February, a reading of 52.4 is still well below the all-time average of 62.9 and represents a very moderate level of expansion. The most significant contributor to September’s expansion is LMI’s three warehousing metrics – Warehousing Capacity, Warehousing Utilization, and Warehousing Prices.
The LMI is calculated using a diffusion index, in which any reading above 50.0 indicates that logistics is expanding; a reading below 50.0 indicates a shrinking logistics industry. The latest results of the LMI summarize the responses of supply chain professionals collected in September 2023.
In regard to the LMI, Zac Rogers, Assistant Professor at Colorado State University, stated, “This second consecutive expansion provides further evidence suggesting that the move towards growth in August was not a one-off occurrence and may have marked a turning point back toward growth in the logistics industry. We could see the index slide back into contraction in the face of a potential government shutdown and the UAW strikes. However, we have generally observed strong growth rates in the fourth quarter, so seasonally speaking, it would be unusual to see a move back toward contraction through the rest of 2023.”
Market Watch
All rates cited below exclude fuel surcharges unless otherwise noted.
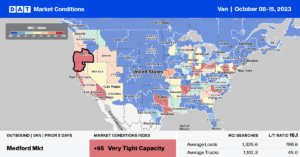
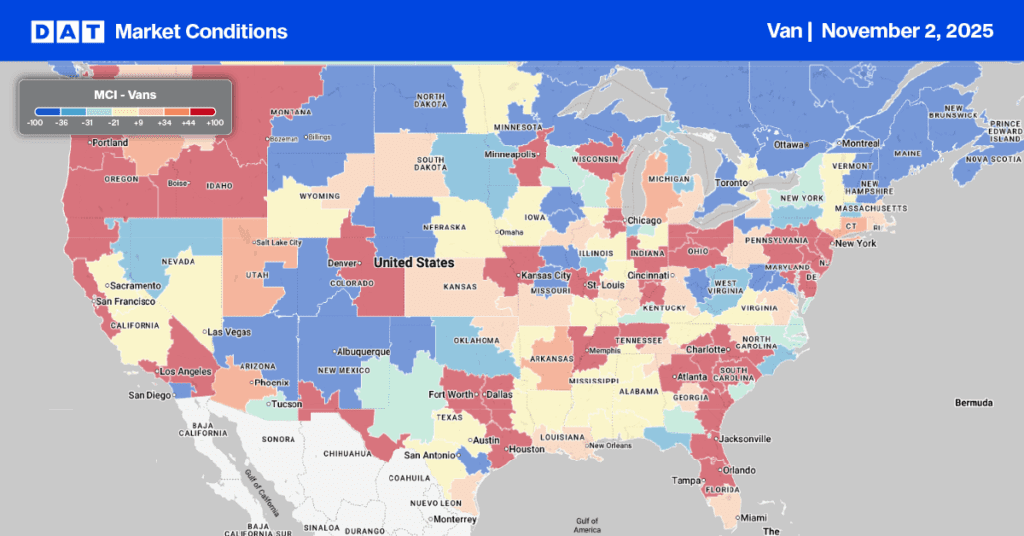
Available capacity loosened in the Top 5 spot freight-producing states (California, Georgia, Illinois, New Jersey, and Texas) last week, with spot rates decreasing by $0.03/mile to an average of $1.72/mile – just $0.05/mile higher than in 2019. San Francisco was the only market in California to post gains last week – spot rates increased by $0.03/mile to an average outbound rate of $1.76/mile. On the 750-mile haul east to Phoenix, carriers were paid an average of $1.88/mile, up $0.05/mile compared to the September average.
September containerized import volume in Los Angeles dropped 8% compared to August, with volumes around 3% lower than in 2019. This translated into fewer spot market moves for carriers on major outbound warehouse market lanes, including Phoenix and Stockton. Loads to Phoenix averaged $2.76/mile last week, just over $2.00/mile lower than the peak during the pandemic-driven import container surge in late 2021. Los Angeles to Stockton loads paid carriers an average of $2.48/mile last week, around $2.25/mile lower than the same period in 2021.
Around one-third of containerized intermodal volume moves on the high-volume Los Angeles to Chicago lane. Spot rates averaged $1.34/mile last week on the lane, just over $2.00/mile lower than at the end of 2021.

Load-to-Truck Ratio (LTR)
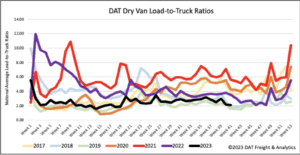
Dry van spot market load posts (LP) decreased for the second week, dropping by 5% week-over-week (w/w) and 48% year-over-year (y/y). Carrier equipment posts decreased slightly in line with the steady flow of carrier exits in the long-haul sector, resulting in last week’s dry van load-to-truck ratio (LTR) mainly remaining flat at 2.09.

Linehaul Spot Rates
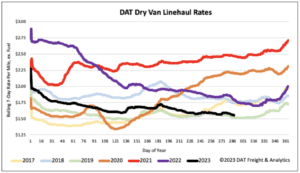
Dry van linehaul spot rates lost more ground following last week’s $0.02/mile decrease. At $1.57/mile, last week’s national average was $0.24/mile lower than last year and only $0.03/mile higher than 2019. Compared to DAT’s Top 50 lanes based on the volume of loads moved, which averaged $1.88/mile last week, the national average is around $0.31/mile lower.


