Import cargo volume at the nation’s major container ports is expected to be 22% lower during the first half of 2023 than last year despite increased consumer spending, according to the Global Port Tracker report released today by the National Retail Federation (NRF) and Hackett Associates. NRF Vice President for Supply Chain and Customs Policy Jonathan Gold says, “Cargo volume is lower than last year, but retailers are entering the busiest shipping season of the year bringing in holiday merchandise.” Global Port Tracker has not yet forecasted the whole year, but the third quarter expectations are 5.97 million TEU, down 7.9% from the same time last year, and the first nine months of the year should total 16.48 million TEU, down 17.6% year over year.
May imports came in very close to 2019 levels, just 18,258 more TEU (twenty-foot equivalent unit) but 19% lower than the previous year. Following the surge in imports in April following the Chinese New Year manufacturing shut down early in the year, May imports increased by 3% sequentially. East Coast TEU volumes were up 2% m/m, while the West Coast reported a 5% m/m increase, led by the number one port for containerized imports at the Port of Los Angeles. TEU import volumes increased by 9% m/m in Los Angeles. Gulf Coast imports decreased by 2% m/m, driven by 5% lower import volumes in Houston.
The port of Los Angeles handled 19% of the total TEU volume in May, followed by New York (17%) and the port of Long Beach (15%), and Savannah (9%). In Los Angeles, furniture was the number one imported commodity – volume was up 9% m/m in May but still 32% lower than the previous year. Footwear and toy imports were up 34% m/m and 25% m/m, respectively. The highest monthly gains for the top 10 commodities imported nationally were in Women’s and Infant wear, with 13% m/m increases. This is undoubtedly driven by the 6.2% increase in births to U.S.-born mothers during the pandemic.
Market Watch
All rates cited below exclude fuel surcharges unless otherwise noted.
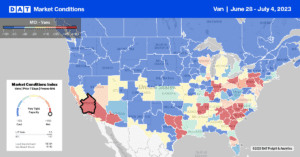
Warehouse distribution freight markets were busy last week in the leadup to the July 4 long weekend, coinciding with the previous shipping week of the month and quarter. Spot rates increased by $0.03/mile to an average of $1.81/mile for outbound loads in Ontario, Phoenix, Memphis, Joliet, Columbus, Atlanta, Harrisburg, and Elizabeth. California outbound spot rates, at $2.12/mile, were up $0.04/mile w/w and $0.09/mile higher than in 2019. Loads from Los Angeles to Phoenix paid carriers $2.79/mile, $0.09/mile higher than the May average and the highest since January. Loads north to Stockton followed a similar trend averaging $2.75/mile.
In the logistics capital of the nation in Memphis, linehaul rates increased for the third week to an average of $1.93/mile, up $0.03/mile w/w. In Atlanta, spot rates increased by $0.02/mile w/w to an average of $1.93/mile after decreasing for the three weeks prior. Loads from Atlanta to Orlando paid carriers $2.68/mile last week, $0.35/mile lower than the previous year. Outbound loads in Elizabeth increased by $0.04/mile to $1.39/mile the last week, and at $1.13/mile, loads to Atlanta are paying carriers $0.36/mile less than the previous year. After dropping for most of June, spot rates in Chicago increased by $0.03/mile to $1.92/mile.
Load-to-Truck Ratio (LTR)
The last shipping week of the month, quarter, and first half year produced an uncharacteristic volume surge in the previous week. Load posts increased by 22% w/w compared to past years, where pre-July 4 volume weekly increase is typically 11%. Last week’s spot market volumes were within a few thousand loads of 2019, around 25% lower than the previous year. Carrier equipment posts dropped by 17% w/w, increasing the dry van load-to-truck ratio (LTR) from 2.41 to 3.54.
Linehaul Spot Rates
Weekly dry van linehaul rates increased for only the fifth time this year following last week’s $0.04/mile increase. At just over $1.72/mile, spot rates have dropped $0.25/mile since the start of the year and are lower by the same amount as last year. Produce season typically impacts dry van rates as capacity shifts to higher-paying refrigerated produce loads, and in a typical year, dry van linehaul rates would increase by $0.18/mile from mid-April to the July 4 long weekend; this year, the increase is just $0.09/mile. Compared to our Top 50 lanes, which averaged $2.02/mile last week, the national average was $0.30/mile lower.


