The latest releases of manufacturing survey data for January are encouraging as we look ahead to what 2023 has in store. Although S&P Global and the Institute of Supply Management ISM manufacturing indexes show a decline in their respective diffusion indexes for the prior three months after 28 months of growth, we are not seeing the sharp declines witnessed in 2019. According to Prof. Jason Miller from Michigan State University, “a silver lining with the durable good new orders data is we are not, as of yet, seeing sharp downturns in new orders as we witnessed in Q3 and Q4 2019. While there is no doubt that durable goods manufacturing in the U.S. has slowed, there are signs of strength in certain sectors, aerospace being one of the most prominent. More data to be closely watched as we move into 2023 to get a sense of where the freight markets are headed.”
According to Chris Williamson, Chief Business Economist at S&P Global Market Intelligence, “Despite rising in January, the PMI remains at one of the lowest levels recorded since the global financial crisis, indicating a worryingly steep rate of decline in the health of the goods-producing sector. ISM reported that of 17 industries covered by the ISM Purchasing Managers Index, two manufacturing industries that reported growth in January are: Miscellaneous Manufacturing; and Transportation Equipment.
After a soft November and December 2022 reading, Prof. Jason Miller noted that new orders exceeded shipments by $14.5 billion with one caveat: December’s new orders were firm because of Boeing’s nondefense aircraft orders. However, New Orders for Nondefense Capital Goods, Excluding Aircraft, were down 0.2% m/m in December.
Market Watch
All rates cited below exclude fuel surcharges unless otherwise noted.
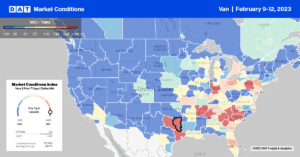
Capacity tightened slightly in the Southeast last week, led by volume gains in Atlanta, the number one spot market in the country last week. Atlanta volumes were up 3% w/w, pushing up outbound rates by a penny-per-mile to an average of $1.68/mile. Regional markets followed a similar trend except for Charleston, S.C., where rates were up by $0.10/mile to $1.87/mile last week. Long-haul loads from Charleston to Kansas City, MO, at $1.80/mile, are the highest since August, with DAT’s Ratecast forecasting spot rates to increase another $0.25/mile on the lane in the next month.
Houston and Dallas freight markets held down the number two and three spots last week even though combined volumes were down 13% w/w. Spot rates in Houston were flat at $1.69/mile and up by $0.02/mile to $1.56/mile for outbound loads in Dallas. Loads moved between Dallas and Houston almost doubled last week, although capacity continued to loosen, with spot rates hitting a 12-month low at $498/load or $2.06/mile. Loads moved in the opposite direction from Houston to Dallas also spiked, increasing by 60% last week but with sufficient available capacity; rates also declined to a 12-month low of $516/load or $2.14/mile. For dedicated carriers on this lane, the average round trip rate last week was $2.10/mile, $0.34/mile higher than the national average.
This time last year, Los Angeles and Ontario markets consistently held down the top two spots; last week, they barely made the Top 20 with volumes at around half what DAT reported in Atlanta and Houston markets. Outbound spot rates in Los Angeles dropped by $0.03/mile last week to $1.67/mile, and in nearby Ontario, rates dropped by $0.06/mile to $1.79/mile. In contrast, capacity tightened in Fresno last week, where rates increased by $0.04/mile to $1.56/mile for outbound loads.
Load-to-Truck Ratio (LTR)
Dry van load posts continue to track closely with 2018 levels following last week’s 16% decrease. Volumes are up 6% m/m and just over 30% higher than the average for the second week of February. Carrier equipment posts were up 3% last week and identical to 2020 as the market continued to shed capacity following the over-supplied 2019 market. As a result of lower load volumes and more equipment posts, the dry van load-to-truck ratio (LTR) decreased slightly last week from 2.79 to 2.37.
Linehaul Spot Rates
Even though dry van linehaul rates decreased by just under $0.03/mile last week, they’re still within $0.03/mile of the average over the prior four months. The national average dry van rate of $1.76/mile is $0.06/mile lower than in 2018, $0.12/mile higher than in 2019, and $0.24/mile lower than the top 50 dry van lanes based on the volume of loads moved, which averaged $2.01/mile last week.


